Data Preview
Data preview (admin) lets you inspect raw and processed series data and dry-run detectors on real loaded data before you rely on production schedules.
Open it from:
- Left nav → Data preview (
/datapreview) - A data view’s top-right Data preview (search) button →
/dataviews/{id}/preview
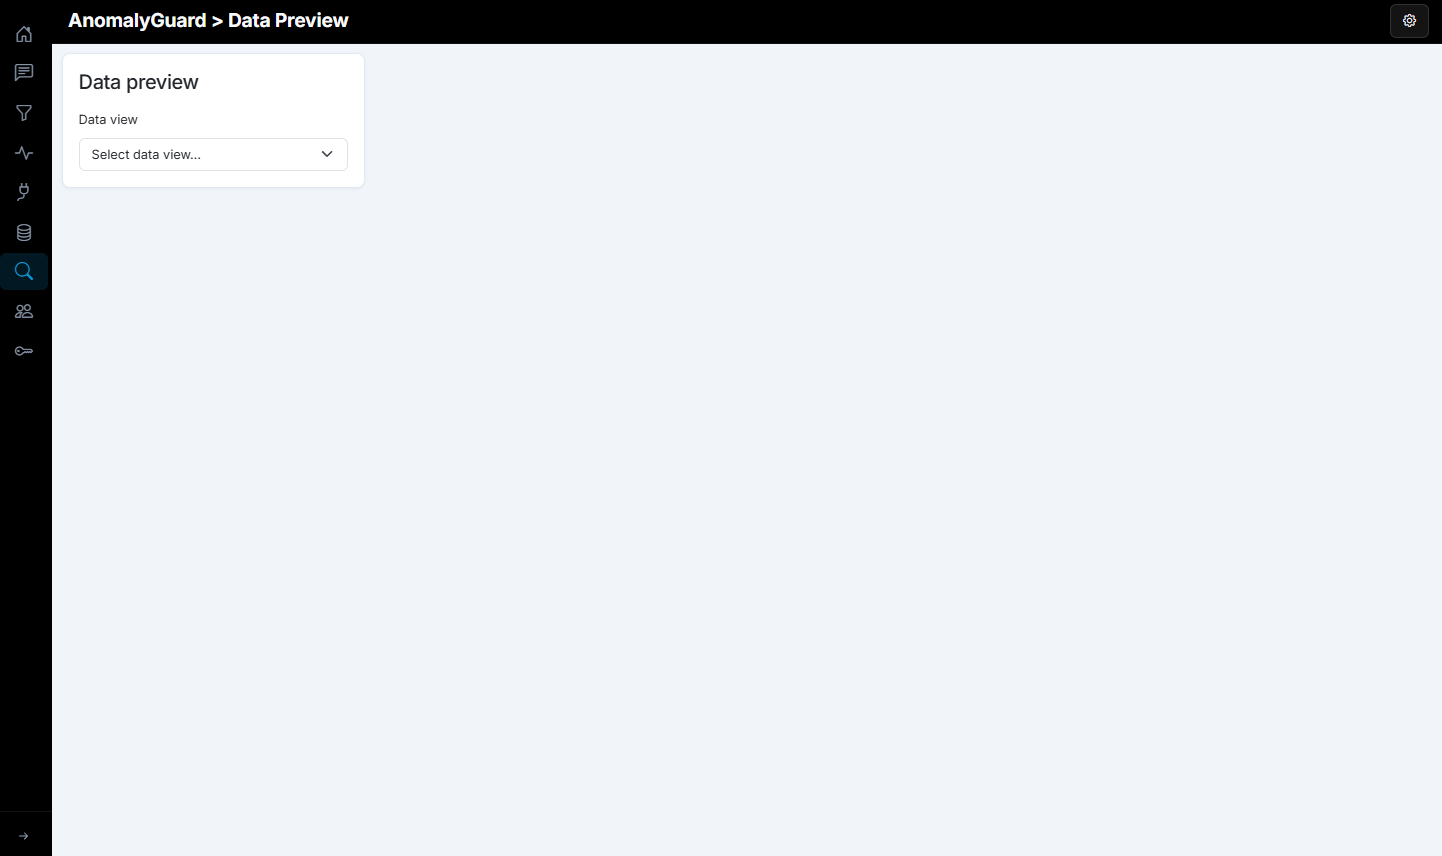
The page starts empty until you select a data view.
Workflow
- Select a data view from the dropdown (
domain / name). - Optionally narrow categories (checkbox per dimension, then pick a value).
- Optionally edit Detectors YAML and Special dates YAML.
- Click Display analysis.
Data view selection
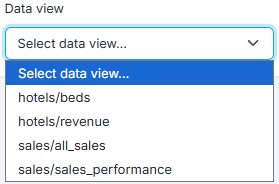
Choose from all available data views. Opening preview from a data view detail pre-selects that view and loads its detector / special-date settings.
Category filters
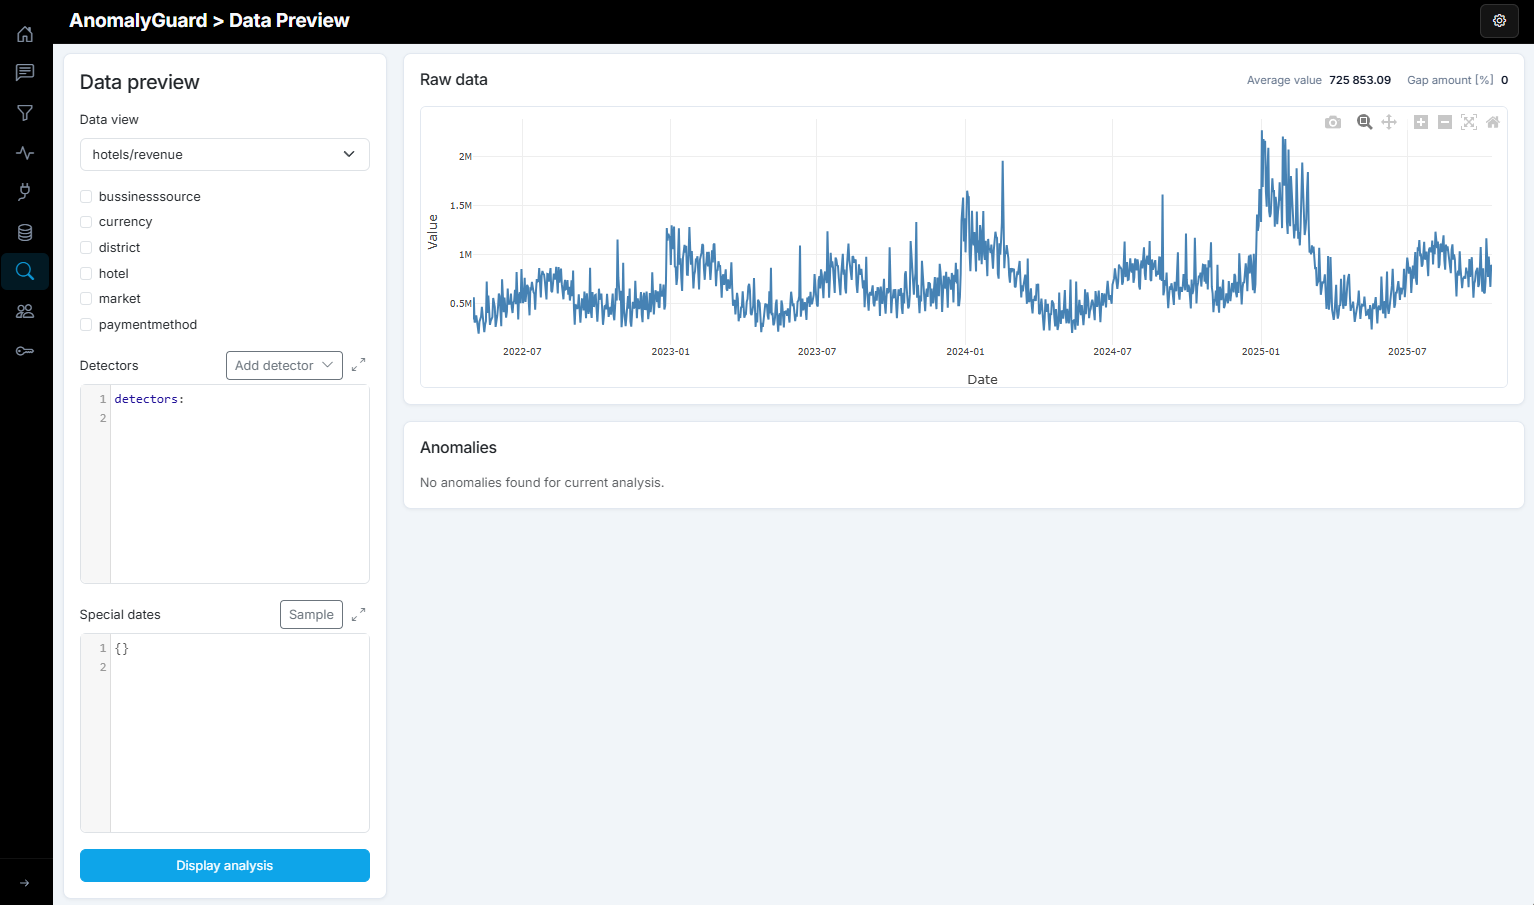
Below the data view selector, checkboxes appear for each category defined on the data view. Enable a category and pick a member value to restrict the series (for example a product type in a region on a given sales channel). Which values appear depends on the data already loaded for that data view.
With no category checkboxes enabled, analysis uses the default / unfiltered series path returned by the analysis engine for that data view.
Detectors and special dates
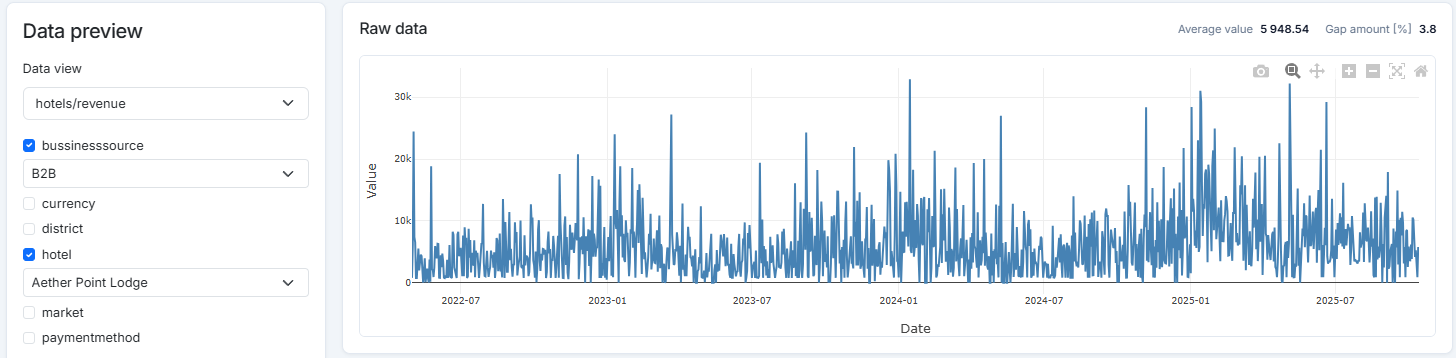
After a data view is selected, two YAML editors appear:
| Editor | Purpose |
|---|---|
| Detectors | Detector YAML for the preview run. The page loads the data view’s first detector by default. Use Add detector to insert a catalog sample (in preview this replaces the first detector entry so you can fine-tune one detector at a time). |
| Special dates | Optional special-date YAML for the run. Use Sample for a template. Rules apply when a detector has useSpecialDates: true. |
Edits here are for the preview session only — they are not written back to the data view until you copy them into the data view Analysis / Special Dates tabs and save.
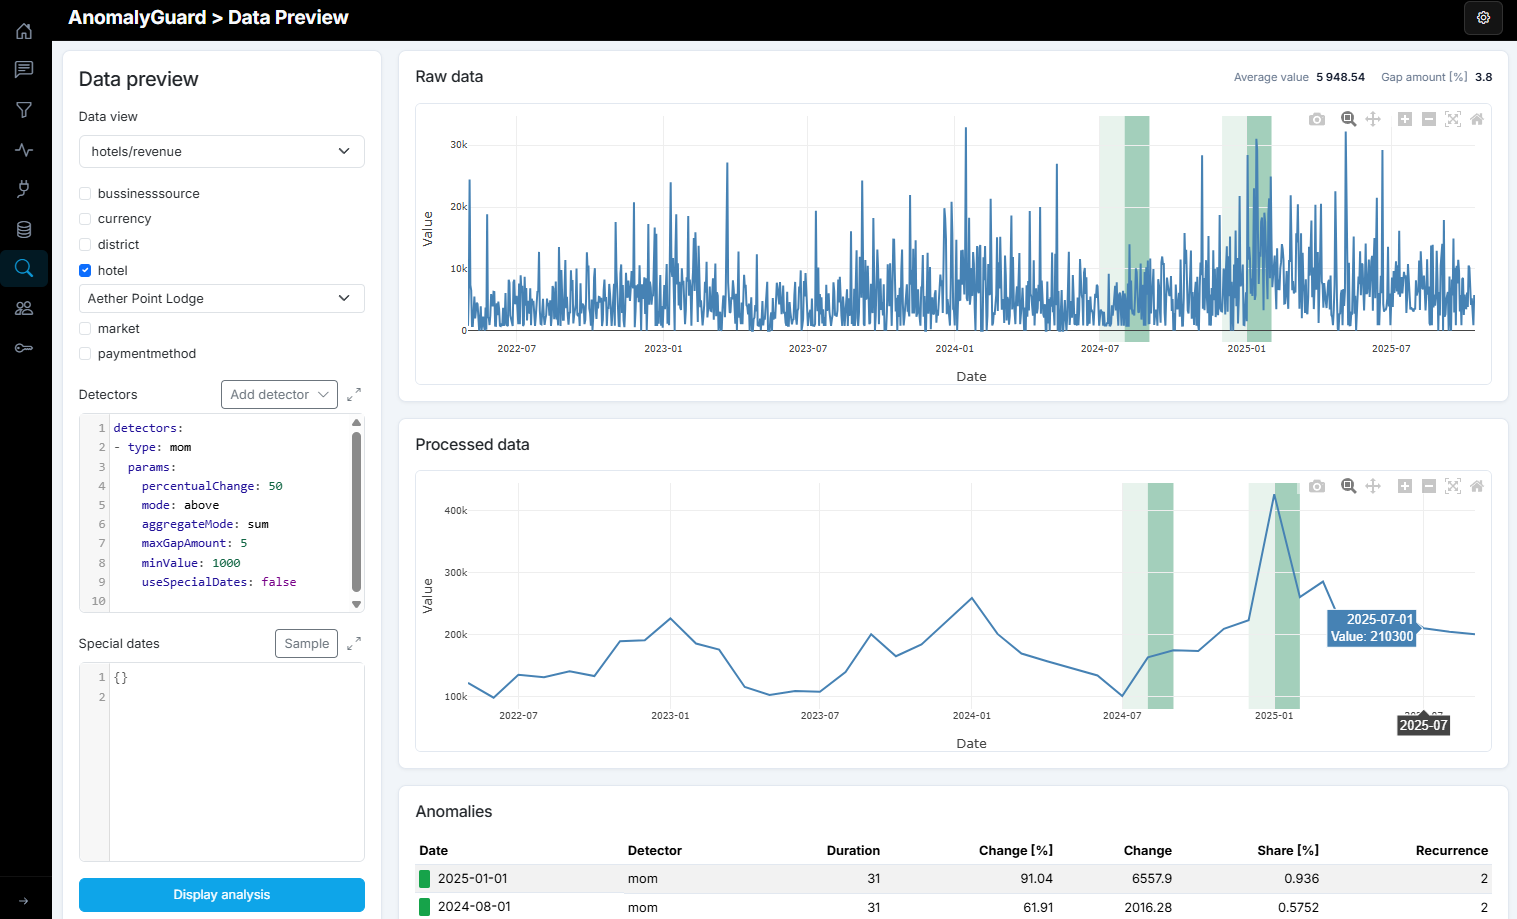
Use this UI to fine-tune detector parameters on real series and reduce false positives or false negatives before enabling cron/API schedules.
Results
After Display analysis, the right panel shows:
| Section | When shown | Contents |
|---|---|---|
| Raw data | Series found | Chart of loaded points, plus Average value and Gap amount [%] |
| Processed data | Processed series non-empty | Chart after gap-fill / preprocessing used by detectors |
| No data for this combination | Empty series | Selected category filters match no records |
| Detectors skipped | One or more detectors skipped | Detector id + reason (for example gap amount too high, average below minValue, or above maxValue) — see Detectors shared series filters |
| Anomalies | Detectors were configured for the run | Table: date, detector, duration, change %, change, share %, recurrence; direction marker (positive / negative). Hidden for chart-only runs (empty detectors YAML) |
Detectors are optional. With no detectors configured, the page still renders series charts when data exists.
Prerequisites and tips
- The data view should be deployed and have data loaded; otherwise there may be nothing to chart.
- Preview is admin-only.
- Category member lists come from loaded fact categories (
GetTopNFactCategories) — load data first if the lists look empty. - Prefer validating one detector at a time in preview, then copy the tuned
paramsinto the data view Analysis YAML (where you can keep multiple detectors). - Pair special dates with
useSpecialDates: trueto check calendar suppression — see Special settings.