Filters
Detectors produce a large cloud of anomalies across data views, time periods, categories, and anomaly types. Filters turn that cloud into named, reusable views — each tailored to a role, team, or decision context in the company.
One person may need a company-wide lens: only the strongest signals, broad product groups, and alerts that matter for leadership. Another may need a narrow operational lens: one region, one channel, a specific set of detectors, and thresholds that would be noise at the enterprise level but critical for a local department. Filters let both coexist without changing the underlying detection.
Typical examples:
- Executive / central control — last 7–30 days, top N by significance or change %, aggregated to high-level categories (for example product group or country), positive and negative spikes that exceed a materiality threshold, optional AI executive summary.
- Regional or product owner — same detection engine, but scoped with a categories filter (
Region=Slovakia), selected data views, and maybe week-over-week (WOW) only — so the list stays actionable for that team. - Analyst deep-dive — custom date range, aggregation off or hierarchical drill-down, full anomaly list, detail charts and comments for investigation.
Filters are saved definitions. You can pin them for quick access on Home, share them with colleagues, leave a share you no longer need, and refresh LLM summaries for the current result set. The Filters page in the web UI is available to administrators. Data users consume saved filters on Home and through the API / CLI (scoped to data views they can access).
Web UI
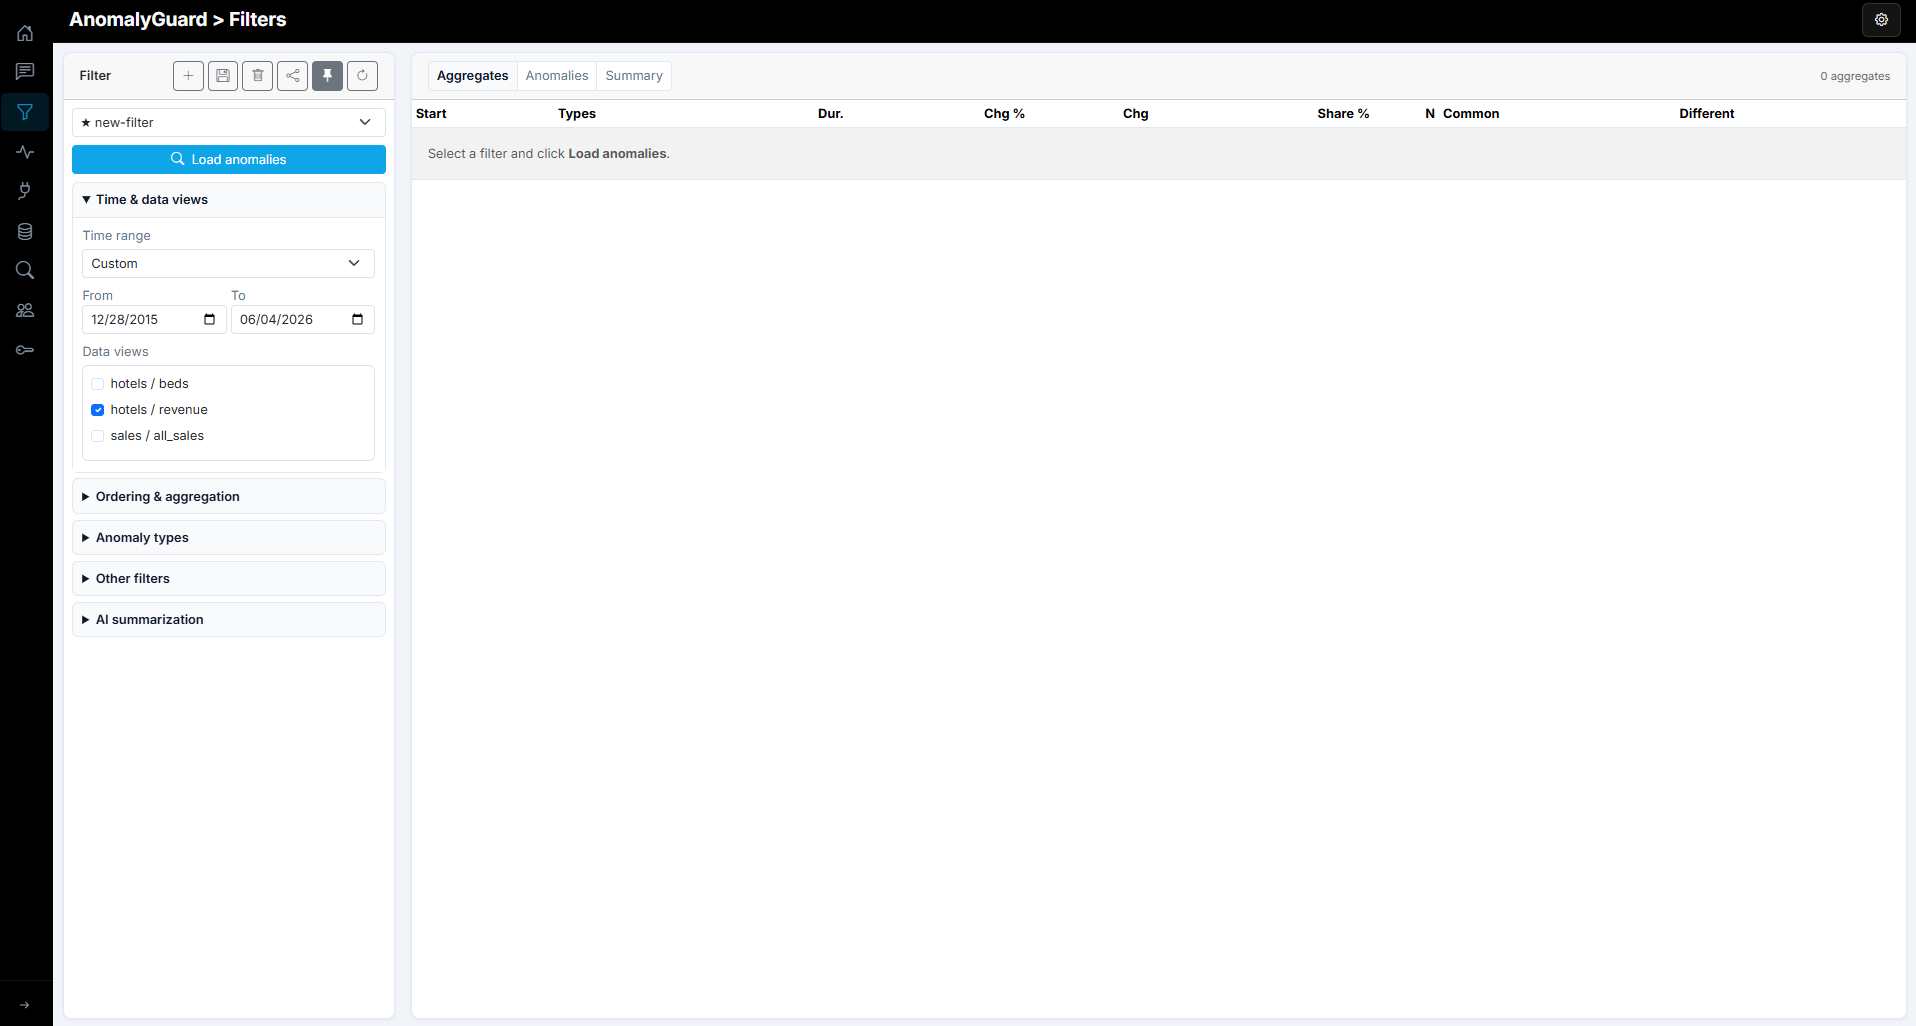
Open Filters in the left navigation. The page has a configuration sidebar on the left and a results area on the right (Aggregates, Anomalies, Summary).
Manage filters
Toolbar actions on the selected filter:
| Action | Purpose |
|---|---|
| Add (+) | Start a new filter (name it, then create) |
| Save | Persist changes (owner only) |
| Delete | Remove the filter for everyone (owner only) |
| Share | Grant access to other users (owner only) |
| Remove share | Stop seeing a filter shared with you — the filter stays with the owner and other recipients |
| Pin | Mark as pinned (star in the dropdown; used on Home) |
| Refresh | Reload filter list and related state |
Pick a saved filter from the dropdown. Pinned filters show a star. Shared filters you do not own can be adjusted locally for a preview run, but you cannot save those changes back to the shared definition.
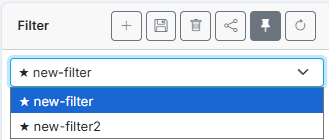
Click Load anomalies to run the current definition against stored detection results.
Time & data views
Choose which time window and data views feed the filter.
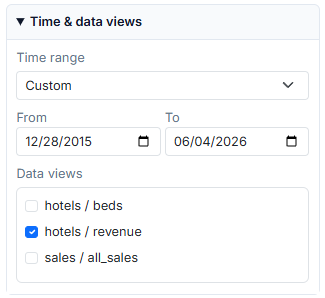
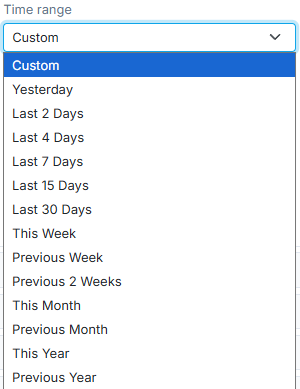
Time range can be a relative preset or Custom (then set From / To):
| Preset | |
|---|---|
| Custom | Explicit from/to dates |
| Yesterday, Last 2 / 4 / 7 / 15 / 30 Days | Rolling lookbacks |
| This Week, Previous Week, Previous 2 Weeks | Calendar weeks |
| This Month, Previous Month | Calendar months |
| This Year, Previous Year | Calendar years |
Under Data views, select one or more views you are allowed to access (shown as domain / name). Only anomalies from those views are included.
Combine data views only when they belong to a coherent analysis context (same business process, comparable metrics and categories). Mixing unrelated datasets can produce misleading aggregates — for example rolling hotel revenue anomalies together with an unrelated sales view as if they shared the same dimensional space.
Ordering & aggregation
Control ranking, result size, description, and whether anomalies are rolled up into groups.
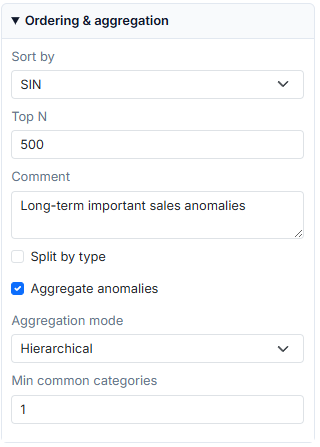
| Setting | Purpose |
|---|---|
| Sort by | Order of returned anomalies (for example Duration, Date, SIN, SIM, Change, Change %, Category Share %) |
| Top N | Cap how many results are returned |
| Comment | Free-text description of the filter’s purpose; also shown as the header for this filter on the Home page |
| Split by type | Separate handling by anomaly type when enabled |
| Aggregate anomalies | Group related anomalies instead of listing only individuals |
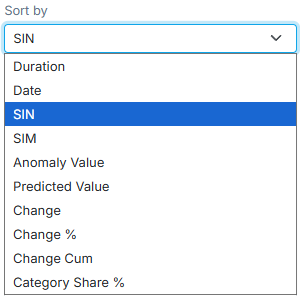
Results are always ordered descending (highest / newest first). Top N then keeps only the first N after that order.
| Sort by | What it ranks on |
|---|---|
| Duration | Length of the anomalous period (anomaly_duration) |
| Date | Anomaly start date |
| SIN | Significance Index Normalized — composite score (see below) |
| SIM | Significance Index Multiplicative — composite score (see below) |
| Anomaly Value | Detected (actual) value in the anomalous window |
| Predicted Value | Model / baseline expected value |
| Change | Absolute change (actual vs expected) |
| Change % | Relative change percent |
| Change Cum | Cumulative change ≈ change × duration |
| Category Share % | Share of this category combination relative to the whole (how “large” the slice is) |
SIN and SIM
After detection, AnomalyGuard recalculates two significance indexes per anomaly so you can rank “what matters most” without sorting on a single metric. Within each peer group (same data view / fact, same anomaly variable, same positive/negative result), duration, change %, and category share % are normalized to 0–1 against the maximum in that group (norm_duration, norm_change, norm_share).
SIN (Significance Index Normalized) — weighted sum of the normalized metrics:
SIN = (2 × norm_share) + (1 × norm_change) + (1.5 × norm_duration)
Share weighs most (×2), then duration (×1.5), then change % (×1). Prefer SIN when you want a balanced ranking that still emphasizes material slices of the business (high share) and longer-lasting issues, without heavily punishing recurring patterns.
SIM (Significance Index Multiplicative) — product of the same normalized metrics, then adjusted by recurrence:
SIM = (norm_change × norm_share × norm_duration) / (1 + ln(recurrence + 1))
An anomaly scores high only if change %, share, and duration are all strong together. Repeated / recurring anomalies are down-weighted by the denominator. Prefer SIM when you want “rare, large, long, high-share” events at the top and recurring noise lower.
When Aggregate anomalies is on, related individual detections are rolled into fewer aggregates. The goal is a readable overview: instead of scanning dozens or hundreds of near-duplicate rows, you see a smaller set of groups that reflect the same business story.
Example. Without aggregation you might get ~15 separate anomalies for the same week — one per city/product combination. With aggregation you might get a handful of groups such as:
- 1 region (shared)
- 2 cities (what differs)
- 1 product group (shared)
- 3 related products (what differs)
So ~100 tiny anomalies can become ~15 aggregates that are easier to prioritize, brief, and summarize. Each aggregate still exposes Common vs Different categories and its member anomalies in detail.
Choose a mode:
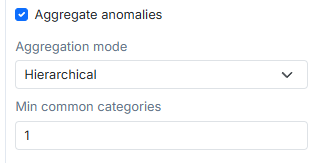
Hierarchical
Groups anomalies that already share enough category values. Min common categories is how many shared dimensions are required to form a group (the algorithm prefers the most stable / least varying dimensions first).
When to use
- Clear category hierarchy (region → city → product group → product)
- You want groups that “roll up” along natural dimensions (all Slovakia / Enterprise spikes together)
- Default choice for executive and regional dashboards where structure of the data is well known
Raise Min common categories for tighter groups (more shared dimensions required → more, smaller aggregates). Lower it for broader rollups (fewer shared dimensions → fewer, larger aggregates).
Graph
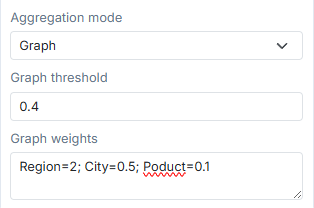
Builds a similarity graph: two anomalies are linked if their weighted category overlap is at least Graph threshold. Connected components become aggregates. Optional Graph weights (Category=weight pairs separated by ;, for example Region=2;City=0.5;Product=0.1) make some dimensions matter more when measuring similarity.
When to use
- Categories are messy or not a strict hierarchy, but related series still share enough labels
- You want soft clustering (“similar enough”) rather than exact shared keys
- You need to emphasize certain dimensions (high weight on
Region) and downplay others (low weight on fine-grained product)
Higher threshold → stricter similarity → more, smaller clusters. Lower threshold → broader merges. Tune weights so the dimensions that define “same business event” dominate the score.
Anomaly types
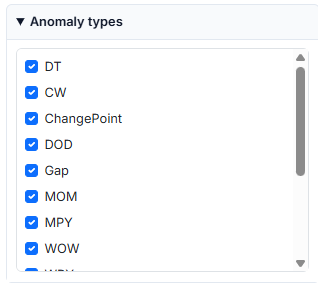
Include only the detector types you care about (for example DT, CW, ChangePoint, DOD, Gap, MOM, MPY, WOW, Spike, QOQ, and related variants). Uncheck types that are noise for this audience.
Other filters
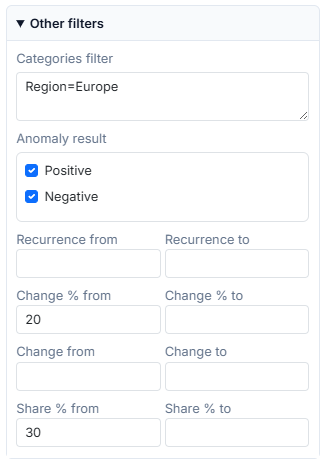
Narrow further by category path and numeric thresholds.
| Setting | Purpose |
|---|---|
| Categories filter | Semicolon-separated constraints, for example Region=Europe or Region=Slovakia;Channel=Online |
| Anomaly result | Positive and/or Negative |
| Recurrence from / to | How often the pattern has recurred |
| Change % from / to | Relative change magnitude |
| Change from / to | Absolute change magnitude |
| Share % from / to | Category share of the total |
Use these to encode “material for HQ” (high change % and share %) versus “local watchlist” (category scoped, lower thresholds).
AI summarization (per filter)
Summarization is optional. Filters, aggregates, and anomaly tables work fully without it. Turn it on only when you want a narrative layer on top of the tabular results.
When enabled, AnomalyGuard calls an external LLM provider of your choice (Azure OpenAI, another OpenAI-compatible endpoint, or any HTTP chat API you configure). You bring the endpoint, authentication headers, and request body; AnomalyGuard injects the built prompt and stores the returned text on the filter.
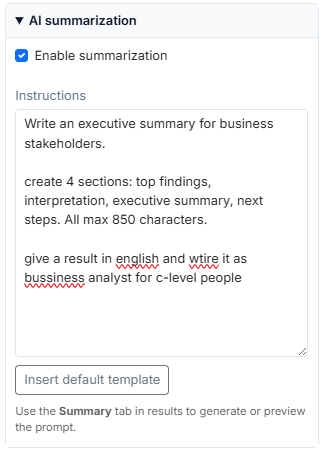
Why use it. Detection output is dense tables (aggregates, change %, share %, categories). Most end users — executives, regional leads, support managers — need a short readable brief, not 50 rows. Summarization turns the current filter result set into prose in any shape you ask for: executive memo, bullet findings, risk register, or a customer-facing status note.
Enable summarization and write Instructions for audience, structure, length, and language. Use Insert default template as a starting point. Generation and preview happen on the Summary results tab — you can also refresh on demand there or via API / CLI.
Automatic refresh. When summarization is enabled on a filter, AnomalyGuard regenerates that filter’s summary after each successful data load and anomaly detection cycle for the data views the filter includes (during index recalculation). Affected filters stay aligned with the latest anomalies without a manual Generate summary click. You can still regenerate manually anytime.
What goes into the prompt. Besides filter settings and the anomaly / aggregate records, the built prompt includes matched comments. That is a second, human information stream: analysts can leave notes on expected dips, known outages, or planned changes, and the summary can treat them as context instead of inventing explanations.
Example: a comment such as “Source system upgrade this week — temporary sales drop is expected and should be ignored” can be reflected in the narrative so leadership does not escalate a known event.
In Instructions you can also ask for recommended next steps (investigate series X, validate data load, brief the region) — either as fixed guidance you write yourself, or by telling the model to propose next steps from the evidence and comments.
Ways to get value
| Pattern | How |
|---|---|
| Leadership morning brief | Filter = company-wide, aggregated, SIN/SIM sorted. Instructions: short English memo with top findings, interpretation, and 3 next steps. Refresh after overnight detection. |
| Regional pack | Categories filter on one region. Instructions in the local language; ask to separate “actionable” vs “explained by comments”. Share the filter with the regional team. |
| Noise reduction with comments | Analysts tag known events via Comments. Instructions: “If a comment says the anomaly is expected, mark it as explained and exclude it from escalation.” |
| Ops handoff | Instructions: structure as ticket-ready bullets (what, where, magnitude, links to categories, suggested owner). Generate before the daily stand-up. |
| Prompt-first QA | Use Generate prompt on the Summary tab to review exactly what the model sees (records + comments) before trusting the prose. |
Per-filter instructions are only the prompt text. The LLM connection (URL, headers, JSON body with {{instructions}}, response path) is configured once under Setup → AI summarization (global).
Open the gear menu → Setup:
Configure the global LLM endpoint and request template:
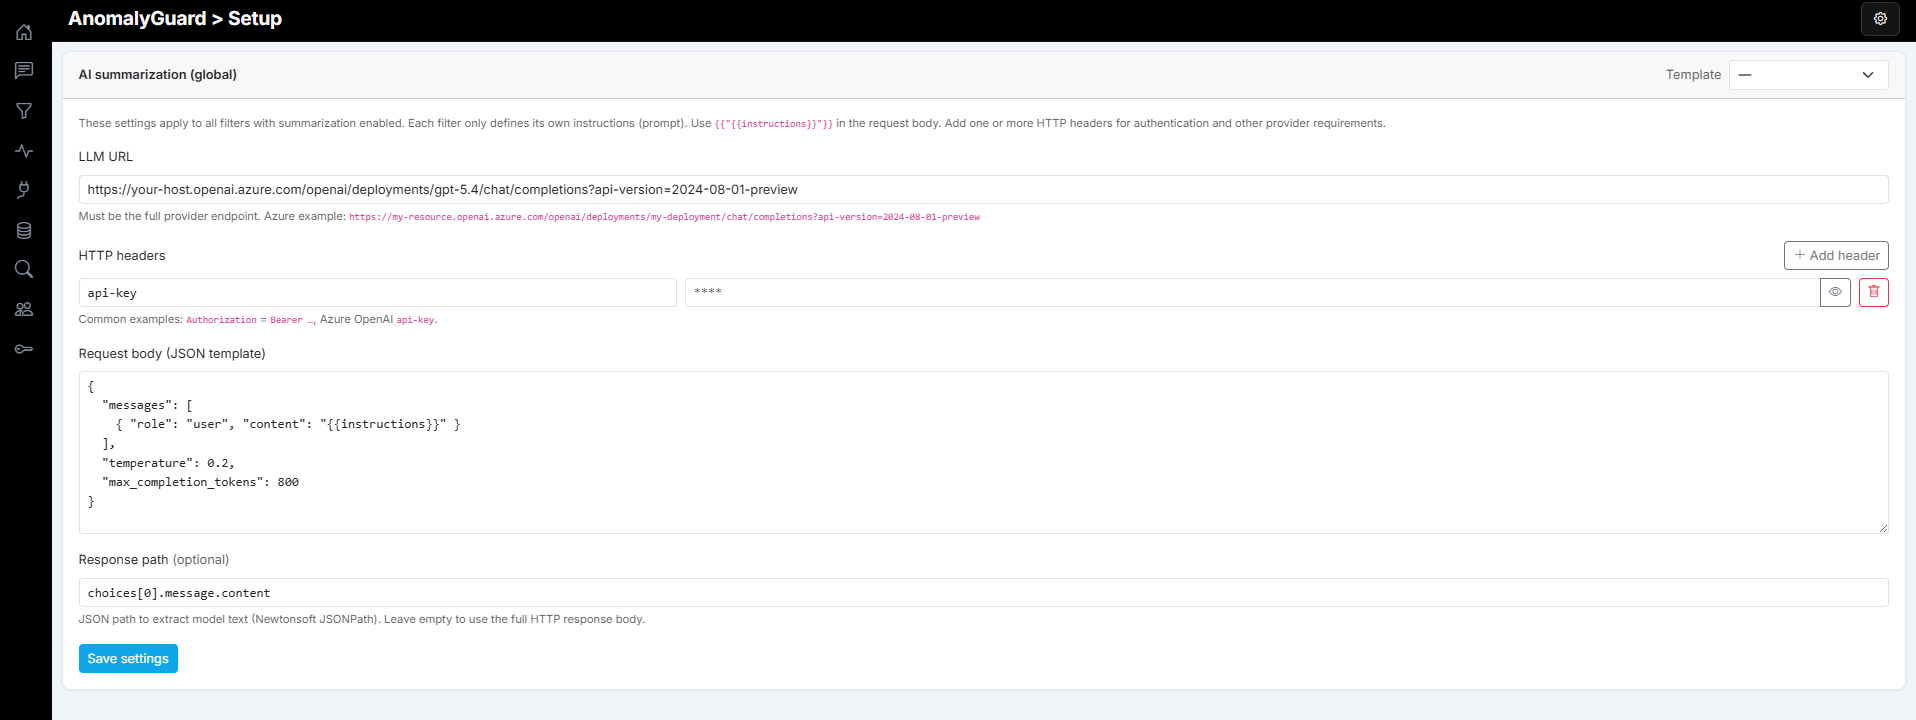
Each filter then supplies its own instructions; the global template injects them via {{instructions}}. Without a working global LLM setup, enabling summarization on a filter has nothing to call.
Results: Aggregates
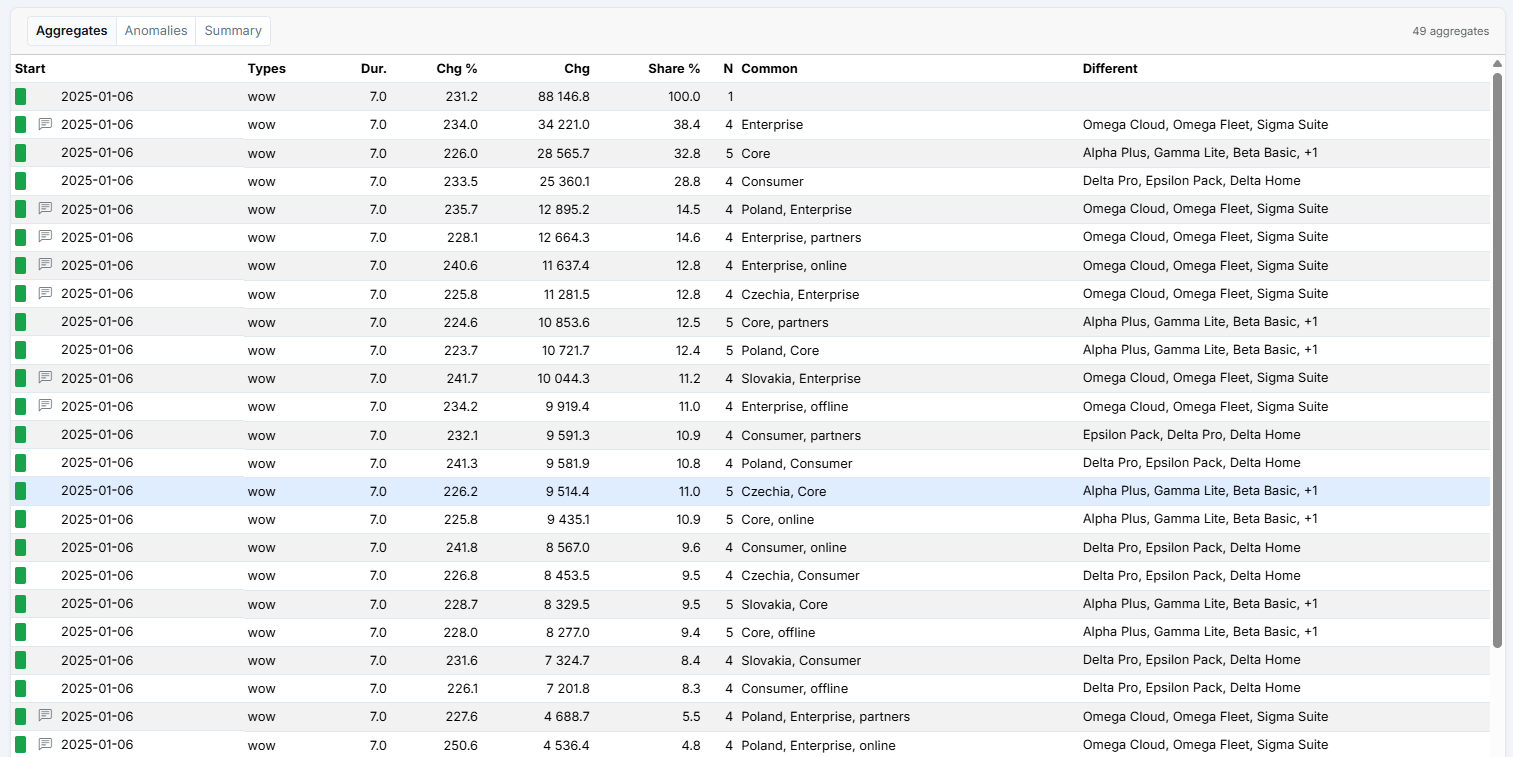
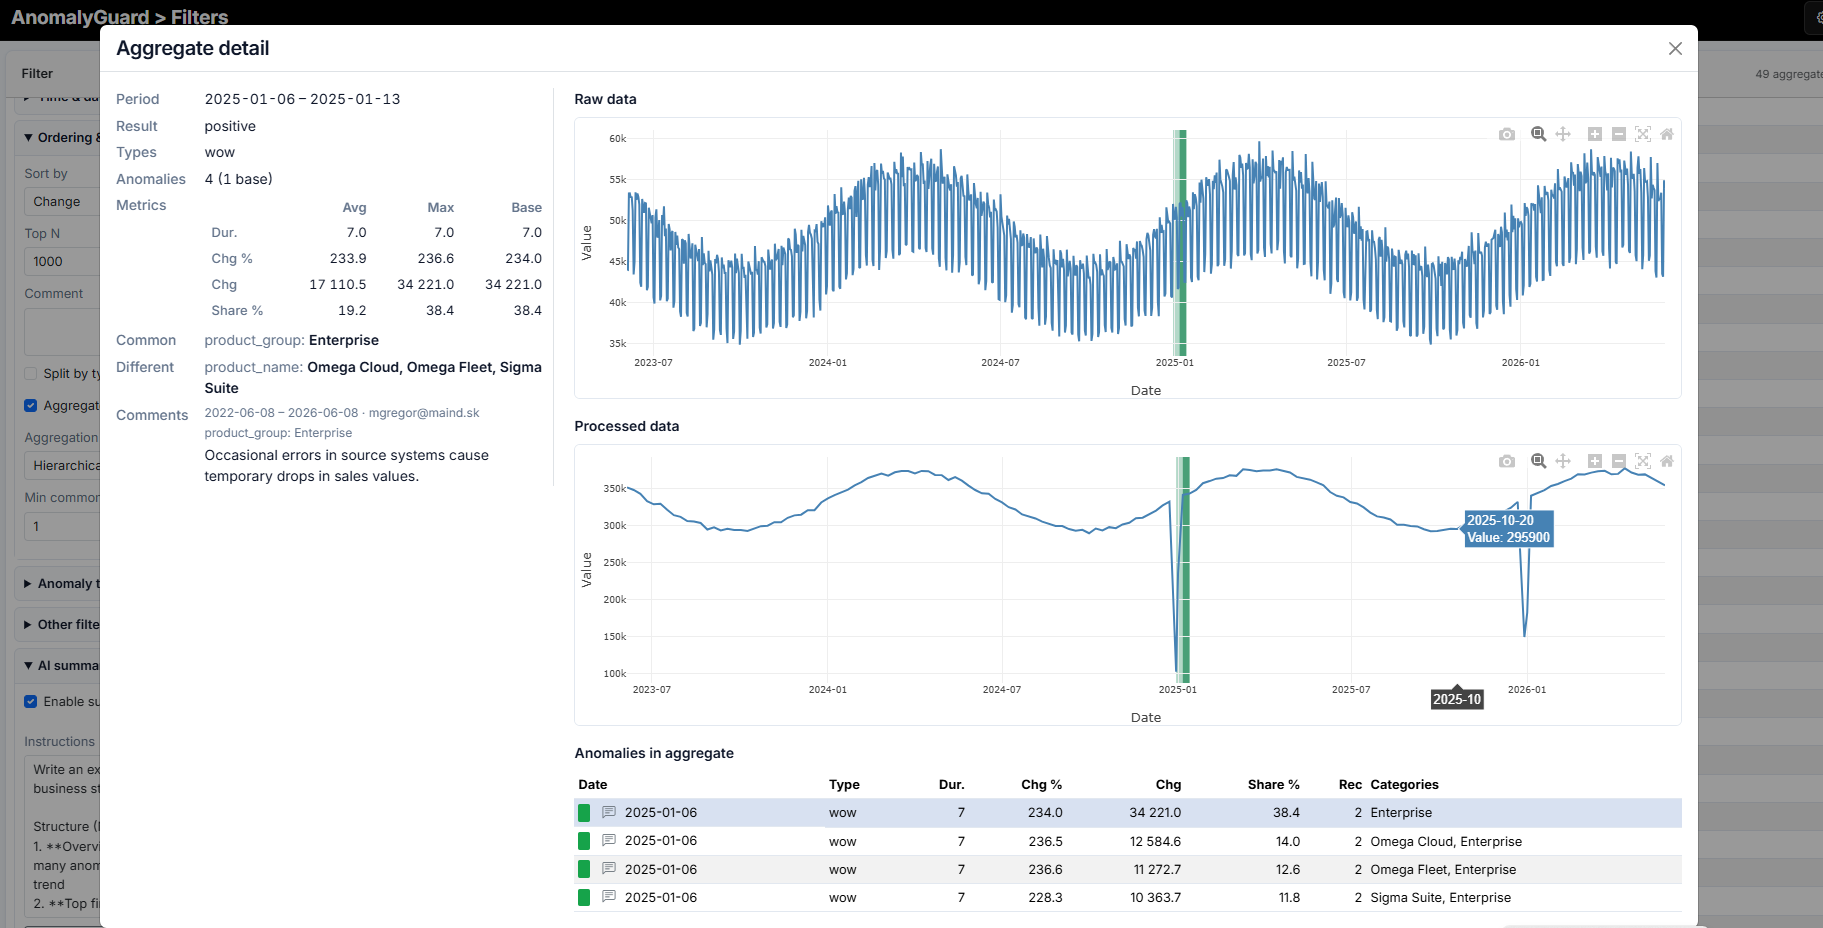
With aggregation enabled, the Aggregates tab shows rolled-up groups: start date, types, duration, change metrics, share %, count (N), Common categories (shared by members), and Different categories (what varies inside the group). Click a row for aggregate detail (metrics, charts, member anomalies, comments).
Results: Anomalies
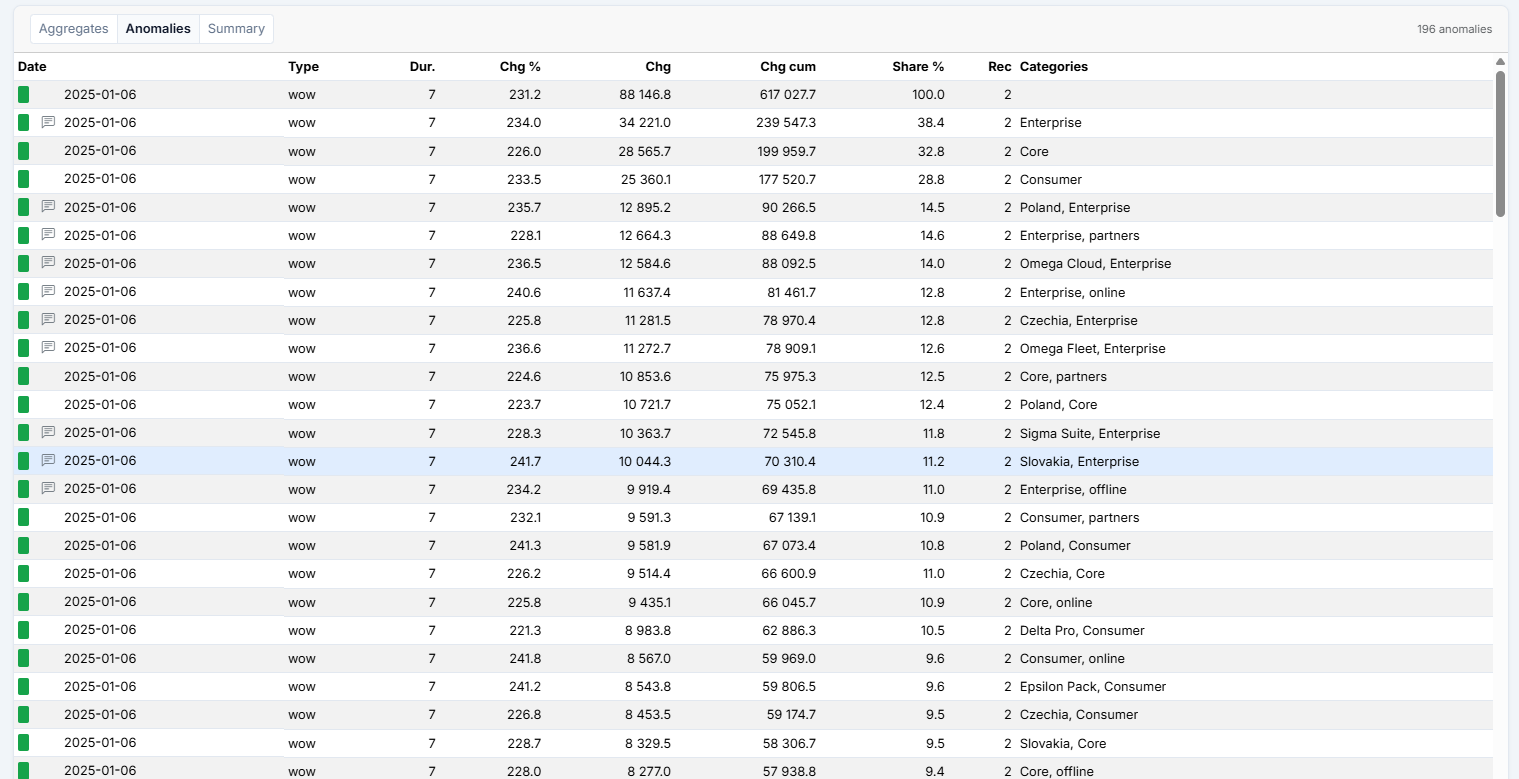
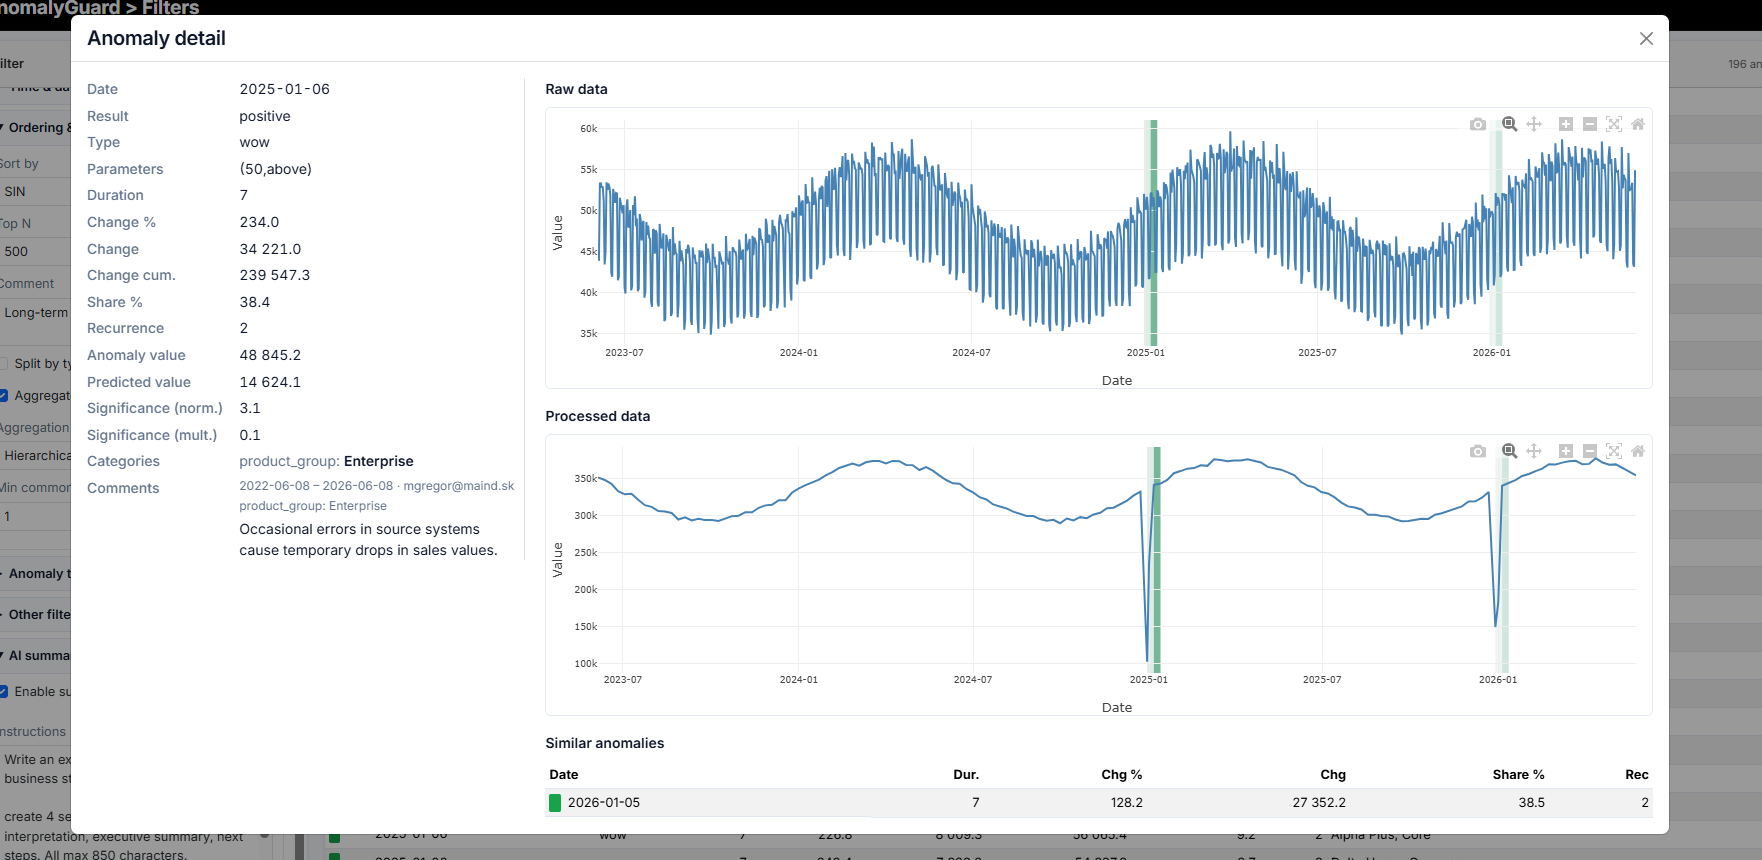
The Anomalies tab lists individual detections (date, type, duration, change metrics, share %, recurrence, categories). Open a row for Anomaly detail: metrics, categories, comments, raw/processed charts, and similar anomalies.
Results: Summary
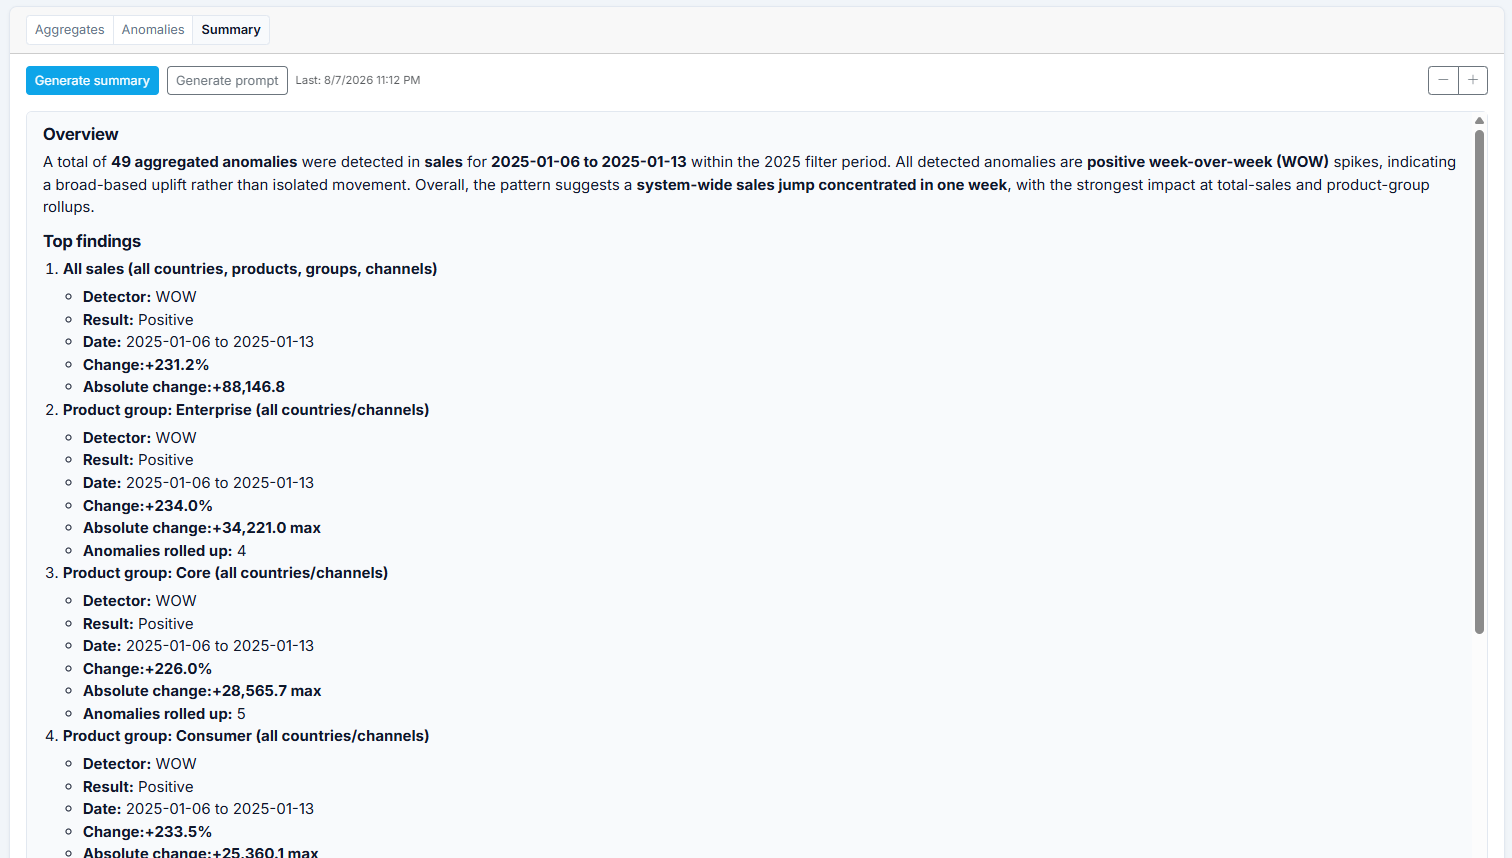
On the Summary tab, generate a narrative over the current filter result set (Generate summary), or inspect the built prompt (Generate prompt). The text reflects the filter’s scope (time range, data views, aggregation) and your instructions — useful for leadership packs or regional briefings without reading every row.
Sharing behavior
| Action | Who | Result |
|---|---|---|
| Share | Owner | Grants selected users access to the filter |
| Remove share (leave) | Recipient | Drops only your share and pin for that filter. The filter is not deleted. |
| Delete | Owner | Deletes the filter for everyone (shares cascade away) |
REST API
Base path: /api/v1/anomaly-filters. Requires data read access (CanReadData). Auth: Bearer token or X-API-Key (see How to use the API).
| Method | Path | Description |
|---|---|---|
| GET | / |
List filters visible to the current user |
| GET | /little |
Compact list (id, name, description) |
| GET | /pinned |
Pinned filters |
| GET | /{id} |
Get one filter |
| POST | / |
Create filter |
| PUT | / |
Update filter (owner) |
| DELETE | /{id} |
Delete filter (owner) |
| GET | /shareable-users |
Users you can share with |
| GET | /{id}/shares |
Current share recipient user IDs |
| POST | /{id}/share |
Set share recipients — body { "targetUserIds": [1, 2] } (owner) |
| DELETE | /{id}/share |
Leave shared filter (recipient — does not delete the filter) |
| PUT | /{id}/pin |
Pin / unpin — body { "pinned": true } |
| GET | /{id}/summarization |
Get stored LLM summary |
| GET | /{id}/summarization/prompt |
Build the summarization prompt |
| POST | /{id}/summarization/refresh |
Refresh summary (optional body { "instructions": "..." }) |
Example: create a filter
POST /api/v1/anomaly-filters
Authorization: Bearer <aad-access-token>
Content-Type: application/json

{
  "name": "Enterprise sales — last 7 days",
  "comment": "Company-wide material WOW spikes",
  "timeRange": "Last 7 Days",
  "dataViews": "sales / all_sales",
  "anomalyTypes": "WOW",
  "anomalyResult": "Positive;Negative",
  "categoriesFilter": "product_group=Enterprise",
  "sortBy": "Change %",
  "limit": 500,
  "isAggregated": true,
  "aggregationMode": "Hierarchical",
  "minCommonCategories": 1,
  "isSummarized": true,
  "instructions": "Write an executive summary for business stakeholders."
}
Example: leave a shared filter
DELETE /api/v1/anomaly-filters/12/share
X-API-Key: <api-key>
Example: pin and refresh summary
PUT /api/v1/anomaly-filters/12/pin
Content-Type: application/json

{ "pinned": true }
POST /api/v1/anomaly-filters/12/summarization/refresh
Content-Type: application/json

{ "instructions": null }
To query anomalies for a saved filter from automation, use the anomalies API / CLI (anomalies by-filter) — see How to use the API and How to use the CLI.
CLI
anomalyguard filters list
anomalyguard filters list-little
anomalyguard filters pinned
anomalyguard filters get 12
anomalyguard filters create --file filter.json
anomalyguard filters update --file filter.json
anomalyguard filters delete 12
anomalyguard filters pin 12 --file '{"pinned":true}'
anomalyguard filters unshare 12
anomalyguard filters summarization 12
anomalyguard filters refresh-summarization 12
filters unshare removes only your access to a shared filter; the owner keeps the filter. Sharing recipients is done via the Web UI or POST /api/v1/anomaly-filters/{id}/share.
anomalyguard anomalies by-filter 12 --json