Monitoring
The Monitoring page shows job queue status and data view processing health. Open it from the left nav (Monitoring, /monitoring).
All users with data read access can open it. The list includes only deployed data views the caller is allowed to see.
List view
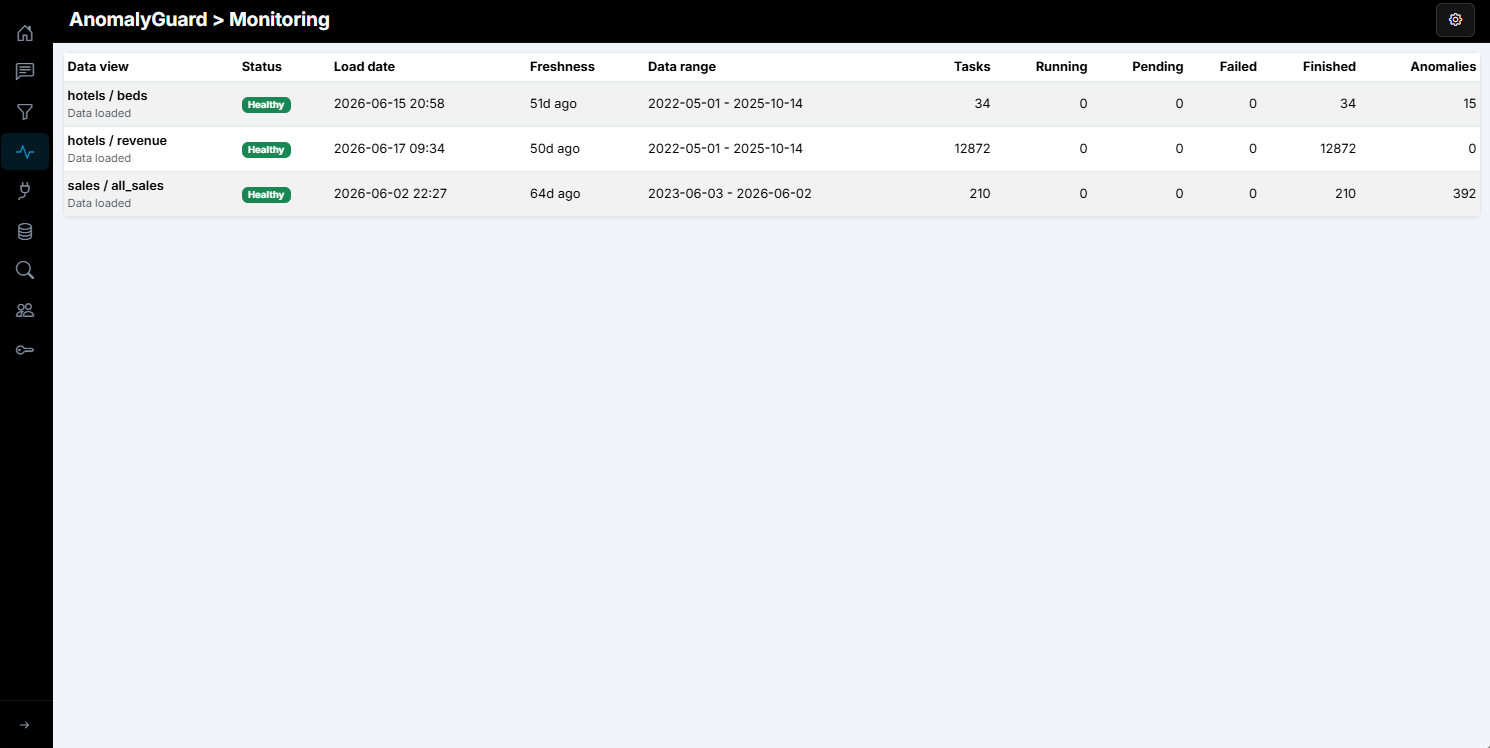
Each row is one deployed data view. Columns:
| Column | Meaning |
|---|---|
| Data view | domain / name, plus Data loaded / Data not loaded |
| Status | Health badge — see below |
| Load date | Last successful load timestamp |
| Freshness | Relative age of the last load (for example 2h 15m ago) |
| Data range | Start–end dates of loaded series data |
| Tasks / Running / Pending / Failed / Finished | Job queue counts for this data view |
| Anomalies | Count of current anomalies |
Click a row (or press Enter) to open the detail view.
Status badges
| Status | Condition |
|---|---|
| Critical | At least one failed task (failedTaskCount > 0) |
| Warning | Not critical, and either data is not loaded, or there are pending or running tasks |
| Healthy | Data loaded and no failed, pending, or running tasks |
Detail view
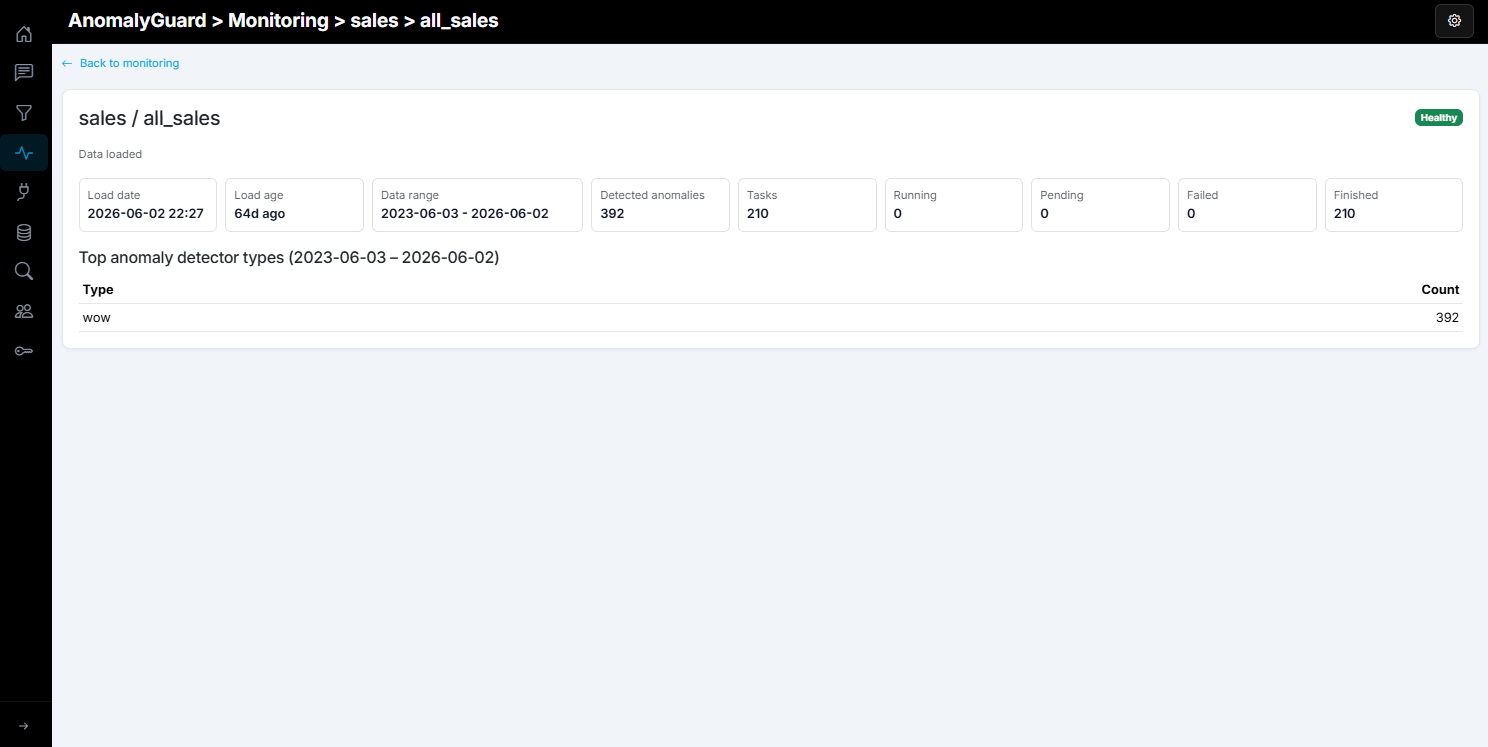
Click a list row to open /monitoring/{id}. The detail repeats the health badge and data-loaded label, then shows richer statistics:
- Load date and load age (freshness)
- Loaded data range (start / end)
- Task totals: all, running, pending, failed, finished
- Detected anomalies count
- When status is Critical: a Last 15 errors table (finished time, task type, message)
- Top anomaly detector types — counts by detector type over the loaded data range (the section title shows the exact
from – todates; up to 8 types, ordered by count)
Note
The status API/CLI returns the health and task counters (same as the list/detail header stats). Last 15 errors and top anomaly types are computed only in the Monitoring detail UI (errors from the task queue; anomaly types via the anomalies query over the loaded range).
Job types
| Job | Typical trigger | Description |
|---|---|---|
| Load | Cron, API, Management, CLI | Load source data into the data view |
| Process | Management, API, CLI (often after load) | Run detectors / analytics on loaded data |
| Custom load | Management, API, CLI | Load via the custom load query |
Enqueue and clear jobs from the data view Management tab, REST API, or CLI. Then watch progress here (or poll status).
Status payload
The same FactStatus object powers the Monitoring list, detail header stats, and the status API/CLI endpoints.
| Field | UI column / meaning |
|---|---|
id, domain, name |
Data view identity |
areDataLoaded |
Whether load finished (no pending load tasks) |
loadDate |
Last load timestamp (freshness / load age in UI) |
startDate, endDate |
Loaded data range |
allTaskCount |
Tasks |
runningTaskCount |
Running (locked tasks) |
pendingTaskCount |
Pending |
failedTaskCount |
Failed — drives Critical |
finishedTaskCount |
Finished |
detectedAnomalies |
Current anomalies count |
Derive the badge the same way as the UI: Critical if failedTaskCount > 0; else Warning if data are not loaded or pending/running counts are greater than zero; else Healthy.
Use the API or CLI to read these fields outside the app (dashboards, CI checks, orchestration).
REST API
Auth: Bearer token or X-API-Key (see How to use the API). Read status requires data-read access; enqueue/clear jobs require process (or admin) permission.
Status (Monitoring list / detail header)
| Method | Path | Description |
|---|---|---|
| GET | /api/v1/access/me/dataviews/status |
Status for all deployed data views the caller can access (list) |
| GET | /api/v1/dataviews/{id}/status |
Status for one deployed data view (detail header) |
Example — list:
GET /api/v1/access/me/dataviews/status
X-API-Key: <your-api-key>
Example — one data view:
GET /api/v1/dataviews/5/status
Authorization: Bearer <aad-access-token>
Example response shape:
{
  "id": 5,
  "name": "sales_by_channel",
  "domain": "sales",
  "loadDate": "2026-08-06T06:15:00",
  "startDate": "2023-01-01T00:00:00",
  "endDate": "2026-08-05T00:00:00",
  "areDataLoaded": true,
  "allTaskCount": 12,
  "pendingTaskCount": 0,
  "runningTaskCount": 0,
  "failedTaskCount": 0,
  "finishedTaskCount": 12,
  "detectedAnomalies": 84
}
Jobs
| Method | Path | Description |
|---|---|---|
| POST | /api/v1/dataviews/{id}/jobs/load |
Enqueue normal load |
| POST | /api/v1/dataviews/{id}/jobs/process |
Enqueue analytics |
| POST | /api/v1/dataviews/{id}/jobs/custom-load |
Enqueue custom load |
| POST | /api/v1/dataviews/{id}/jobs/clear |
Clear queued jobs (admin) |
| POST | /api/v1/dataviews/{domain}/{name}/jobs/load |
Load by domain/name |
| POST | /api/v1/dataviews/{domain}/{name}/jobs/process |
Process by domain/name |
| POST | /api/v1/dataviews/{domain}/{name}/jobs/custom-load |
Custom load by domain/name |
| POST | /api/v1/jobs/{domain}/{name}/load |
Orchestration alias — load |
| POST | /api/v1/jobs/{domain}/{name}/process |
Orchestration alias — process |
| POST | /api/v1/jobs/{domain}/{name}/custom-load |
Orchestration alias — custom load |
After enqueueing, poll GET …/status (or refresh Monitoring) until pendingTaskCount / runningTaskCount return to zero and check failedTaskCount.
CLI
Commands map 1:1 to the endpoints above (see How to use the CLI). Add --json for machine-readable output.
Status
# All accessible deployed data views (Monitoring list)
anomalyguard access me-dataviews-status --json

# One data view (Monitoring detail header)
anomalyguard dataviews status 5 --json
Jobs
anomalyguard dataviews jobs-load 5
anomalyguard dataviews jobs-process 5
anomalyguard dataviews jobs-custom-load 5
anomalyguard dataviews jobs-clear 5
Typical check after a pipeline load:
anomalyguard dataviews jobs-load 5
anomalyguard dataviews status 5 --json