Seasonal Residual (SR)
YAML type: sr | Category: Adaptive
Decomposes trend + seasonal baseline and flags residual outliers via robust z-score.
Description
SR models expected value as trend plus seasonal phase, then scores residuals. Best when a fixed season length (for example 7) fits the series.
How it works
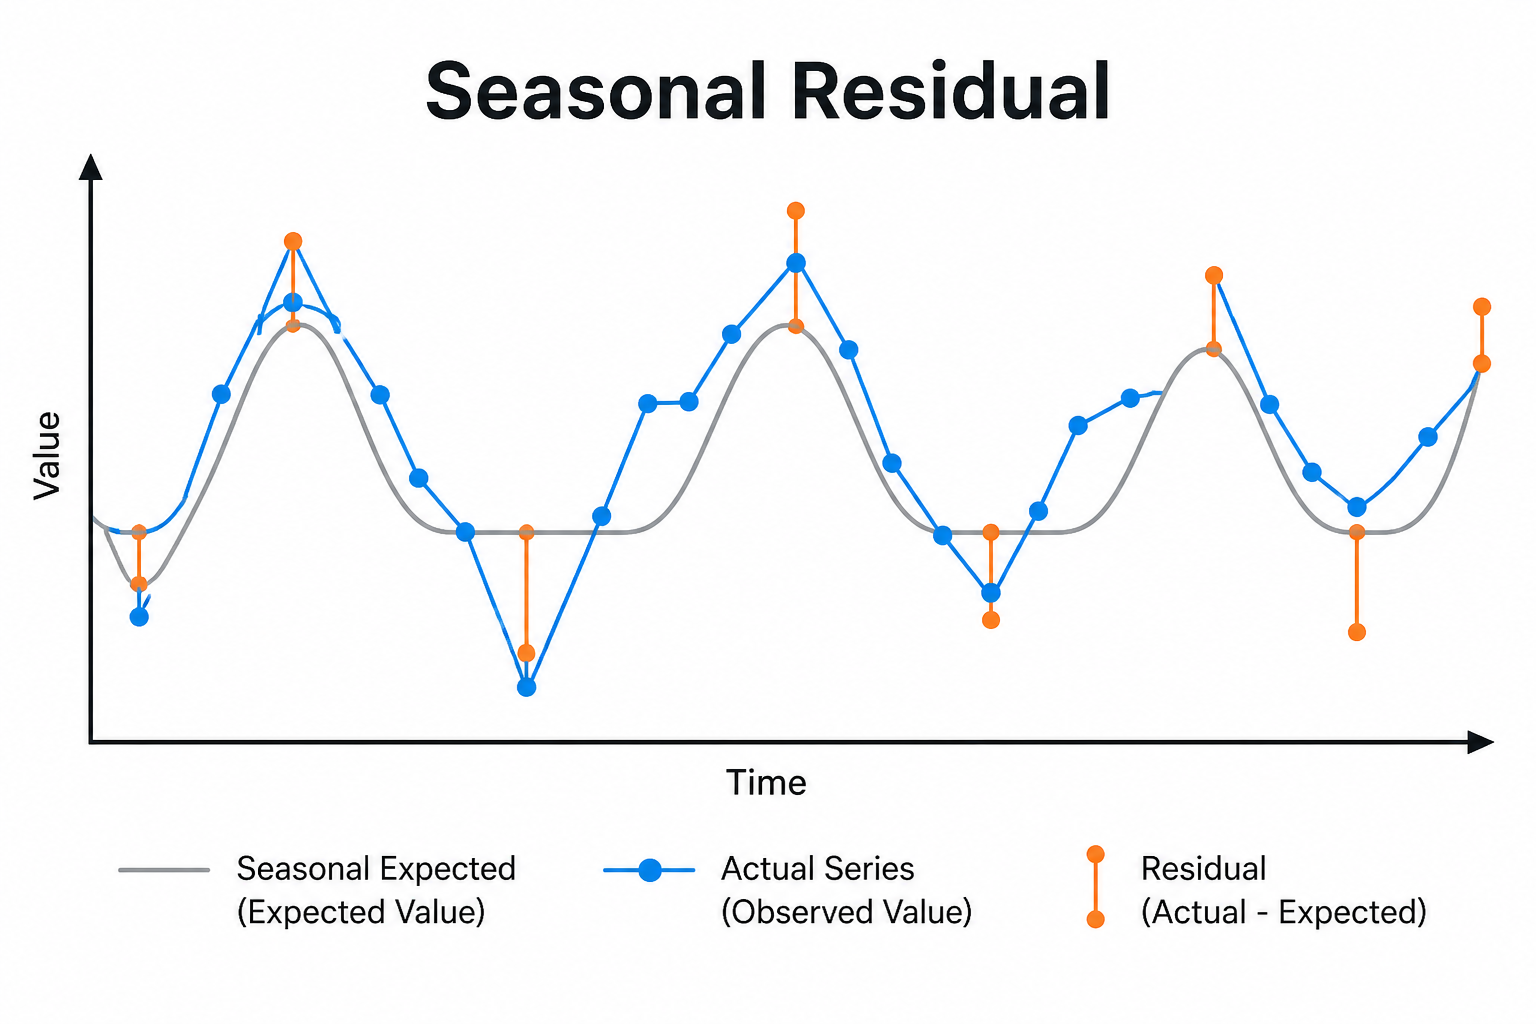
Seasonal Residual decomposes recent history into a trend plus a seasonal phase baseline of length seasonLength (for example 7 for weekly patterns). The residual (actual minus expected) is scored with a robust z-score.
When the residual exceeds zThreshold (and optional minResidualAbs), an SR anomaly is raised. Best when a repeating seasonal cycle is present and simple % comparisons are too noisy.
Setup
Set seasonLength (7 for weekly), trendWindow, historyDays, and zThreshold.
Configure detectors on the data view Analysis tab or in YAML. Validate with Data Preview before enabling production schedules.
Settings
| Parameter | Default | Description |
|---|---|---|
seasonLength |
7 |
Seasonal period length in days |
trendWindow |
21 |
Trend smoothing window |
historyDays |
90 |
History for decomposition |
zThreshold |
3.5 |
Robust z-score threshold |
mode |
both |
Direction -- see Allowed values |
minResidualAbs |
0 |
Ignore tiny absolute residuals |
Allowed values
mode
| Value | Meaning |
|---|---|
above |
Flag increases / values above the comparison (or high side of a band) |
below |
Flag decreases / values below the comparison (or low side of a band) |
both |
Flag either direction |
Applied to the robust z-score of the seasonal residual (actual minus trend+season expected).
Shared series filters
Most detectors also accept optional series filters in params:
| Parameter | Purpose |
|---|---|
maxGapAmount |
Skip series when gap amount is too high (null = no limit). Catalog create-default is often 5. |
minValue |
Skip series whose average value is below this (null = no limit). Catalog create-default is often 1000. |
maxValue |
Skip series whose average value is above this (optional; omit/null = no limit) |
useSpecialDates |
When true, suppress anomalies that overlap special dates |
When a filter skips a series, Data Preview shows the reason.
Configuration example
analysis:
  detectors:
    - type: sr
      params:
        seasonLength: 7
        trendWindow: 21
        historyDays: 90
        zThreshold: 3.5
        mode: both
        minResidualAbs: 0.0
Using the detector
Use when weekday/weekend patterns dominate and simple % comparisons are too noisy.
Use cases
- Weekly seasonal demand
- Call-center volumes
- Website traffic with strong day-of-week effects