Volatility
YAML type: volatility | Category: Adaptive
Detects regime shifts in variability (noise), not just mean level.
Description
Compares short-window scale (mad or std) to a longer baseline scale using ratioThreshold.
How it works
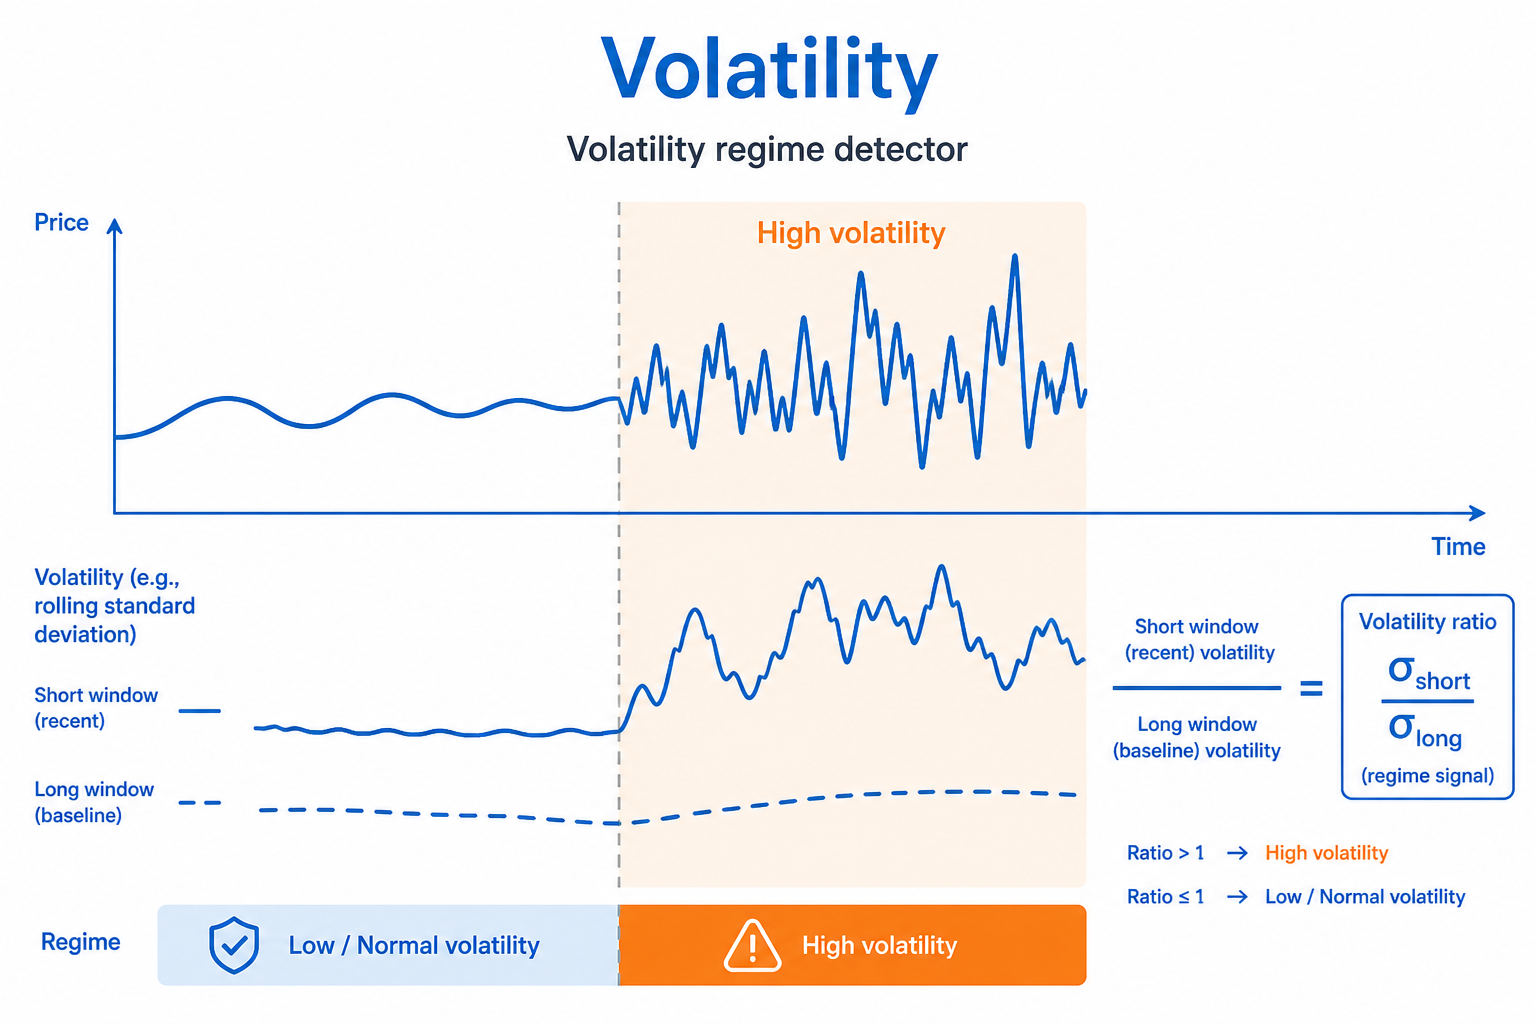
Volatility compares a short-window scale (mad or std over windowDays) to a longer baseline scale (baselineDays). When the ratio crosses ratioThreshold in the configured mode, it flags a variability regime shift.
The mean level can stay stable while noise rises or falls -- that is exactly what this detector is for.
Setup
Use method: mad for robustness to outliers; tune ratio for how large a volatility jump matters.
Configure detectors on the data view Analysis tab or in YAML. Validate with Data Preview before enabling production schedules.
Settings
| Parameter | Default | Description |
|---|---|---|
windowDays |
14 |
Short window for current scale |
baselineDays |
60 |
Longer baseline scale |
ratioThreshold |
2.0 |
Current/baseline ratio to flag |
method |
mad |
Scale method -- see Allowed values |
mode |
above |
Direction -- see Allowed values |
Allowed values
method
How short-window and baseline scale (variability) are measured.
| Value | Meaning |
|---|---|
mad (default) |
Median absolute deviation from the median (robust to outliers) |
std |
Population standard deviation |
stdev |
Alias of std |
mode
| Value | Meaning |
|---|---|
above |
Flag increases / values above the comparison (or high side of a band) |
below |
Flag decreases / values below the comparison (or low side of a band) |
both |
Flag either direction |
above: current/baseline scale ratio>= ratioThreshold(noise up)below: ratio<= 1/ratioThreshold(noise down)
Shared series filters
Most detectors also accept optional series filters in params:
| Parameter | Purpose |
|---|---|
maxGapAmount |
Skip series when gap amount is too high (null = no limit). Catalog create-default is often 5. |
minValue |
Skip series whose average value is below this (null = no limit). Catalog create-default is often 1000. |
maxValue |
Skip series whose average value is above this (optional; omit/null = no limit) |
useSpecialDates |
When true, suppress anomalies that overlap special dates |
When a filter skips a series, Data Preview shows the reason.
Configuration example
analysis:
  detectors:
    - type: volatility
      params:
        windowDays: 14
        baselineDays: 60
        ratioThreshold: 2.0
        method: mad
        mode: above
Using the detector
Alerts when the process becomes noisier (or quieter) even if the mean is stable.
Use cases
- Trading / pricing instability
- Ops metrics that become erratic after a release
- Detecting calmed regimes after remediation (
mode: below)