Week over Week (WoW)
YAML type: wow | Category: Periodic
Compares the current week aggregate to the previous week.
Description
WoW rolls daily values into weeks (sum or average) and compares consecutive weeks.
How it works
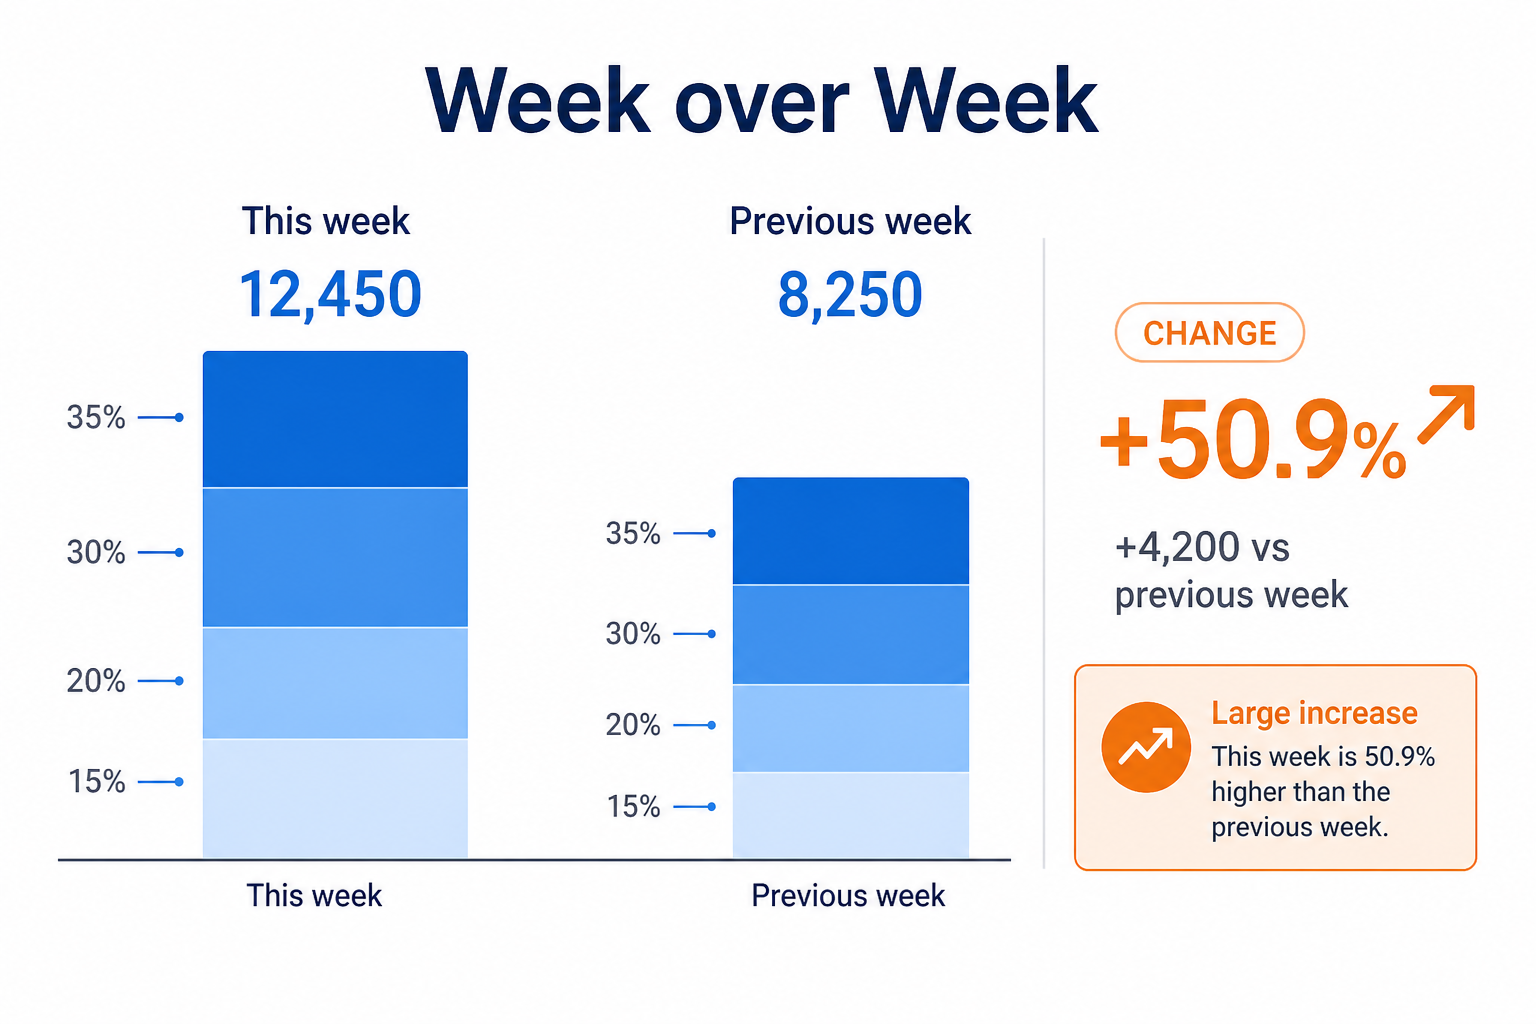
Week over Week first rolls daily values into a week using aggregateMode (sum or average), then compares the current week to the previous week.
If the percentual change exceeds the threshold in the allowed direction, a WoW anomaly is created. Data Preview can show the aggregated weekly series so you see the same grain the detector uses.
Setup
Choose aggregateMode to match how the business reads weekly KPIs.
Configure detectors on the data view Analysis tab or in YAML. Validate with Data Preview before enabling production schedules.
Settings
| Parameter | Default | Description |
|---|---|---|
percentualChange |
50 |
Minimum absolute % change |
mode |
both |
Direction -- see Allowed values |
aggregateMode |
sum |
Period aggregation -- see Allowed values |
Allowed values
mode
| Value | Meaning |
|---|---|
above |
Flag increases / values above the comparison (or high side of a band) |
below |
Flag decreases / values below the comparison (or low side of a band) |
both |
Flag either direction |
aggregateMode
Used when the detector compares period totals (week / month / quarter), not raw daily points.
| Value | Meaning |
|---|---|
sum |
Compare sums of daily values in the period (default) |
average |
Compare averages of daily values in the period |
Shared series filters
Most detectors also accept optional series filters in params:
| Parameter | Purpose |
|---|---|
maxGapAmount |
Skip series when gap amount is too high (null = no limit). Catalog create-default is often 5. |
minValue |
Skip series whose average value is below this (null = no limit). Catalog create-default is often 1000. |
maxValue |
Skip series whose average value is above this (optional; omit/null = no limit) |
useSpecialDates |
When true, suppress anomalies that overlap special dates |
When a filter skips a series, Data Preview shows the reason.
Configuration example
analysis:
  detectors:
    - type: wow
      params:
        percentualChange: 40.0
        mode: both
        aggregateMode: sum
Using the detector
Data Preview shows aggregated weekly series for these detectors when applicable.
Use cases
- Weekly revenue and orders
- Support ticket volumes
- Campaign week comparisons
Specifics
YoY week: wpy.