Home
Home is the day-to-day landing page for anomaly results. It does not define what to look for — that is done with Filters. Home presents the filters you (or someone who shared with you) have pinned, in a layout meant for quick scanning: a readable header, optional AI summary, and tiles for anomalies or aggregates.
Anyone with assigned data-view access can use Home. Administrators configure and pin filters on the Filters page; other users consume those views here (and via API / CLI).
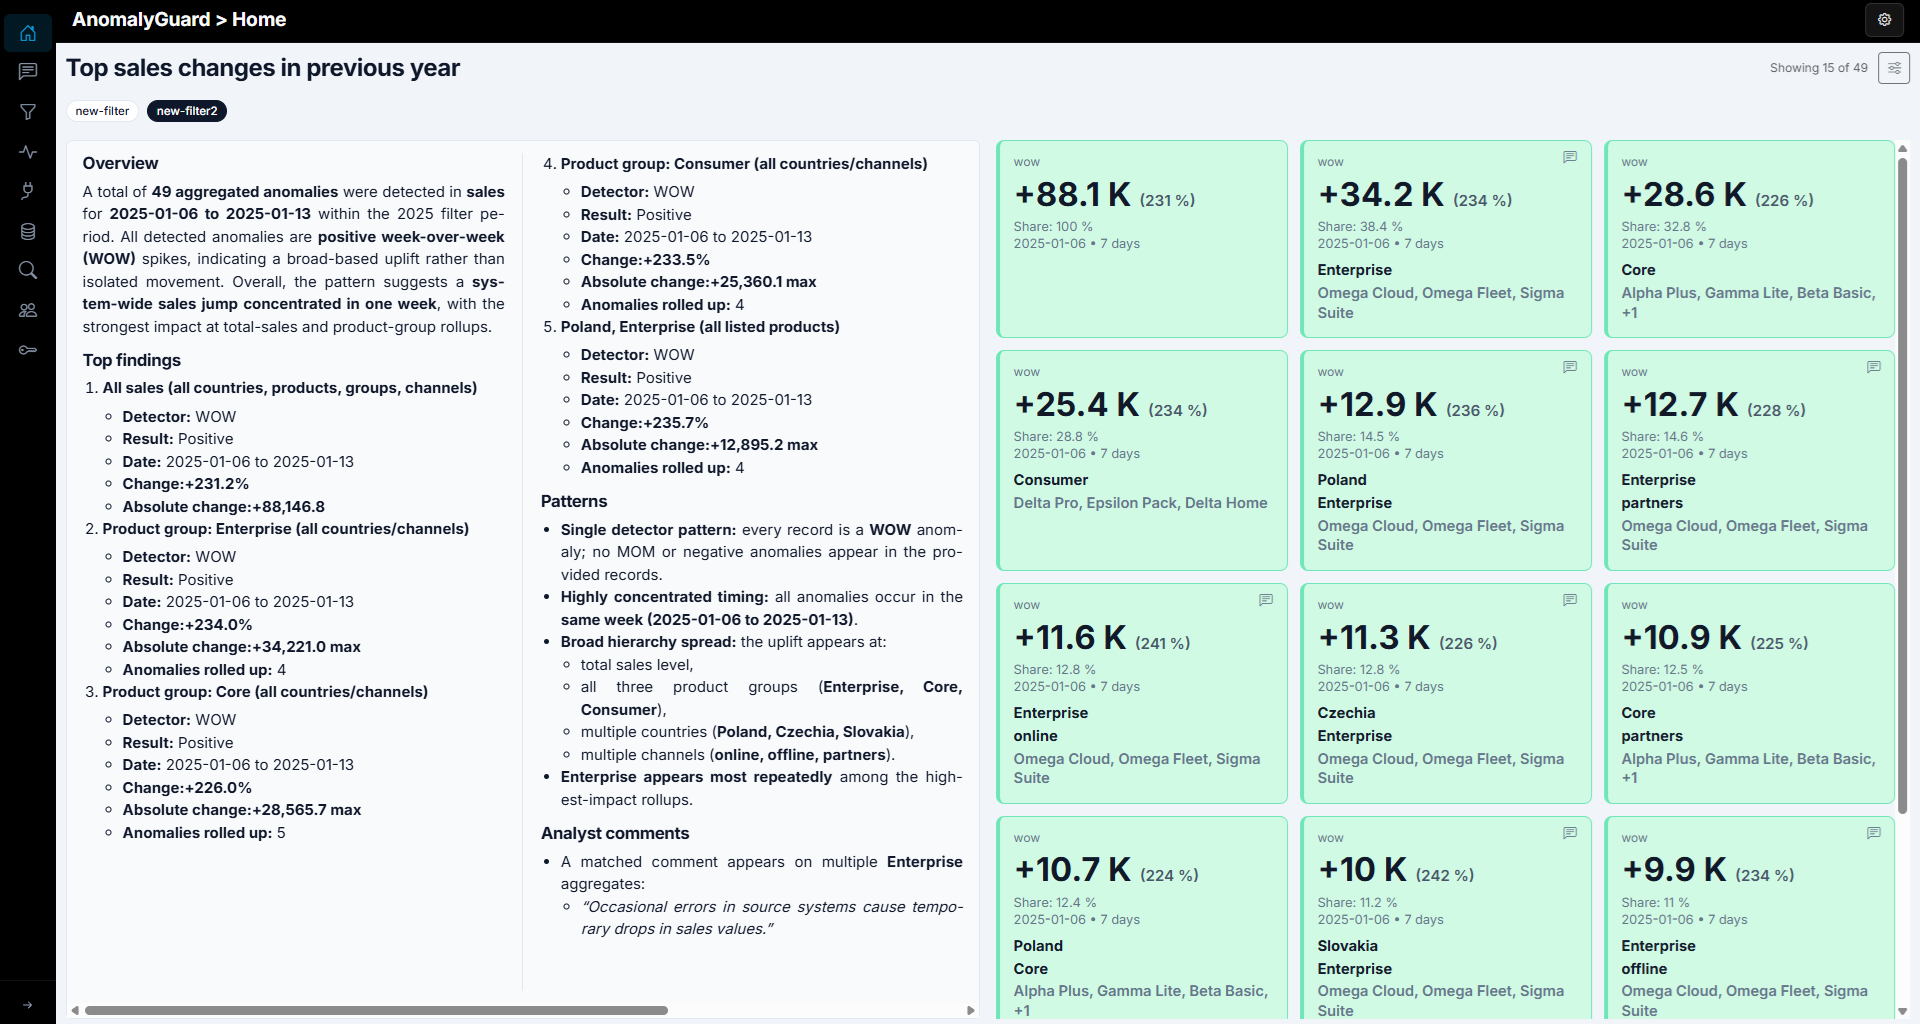
What you see
- Title — the filter’s Comment field (purpose text), not only the technical filter name. Example: Top sales changes in previous year.
- Filter strip — chips for each pinned filter; click one to switch the active view.
- Results — depending on display settings: anomaly or aggregate tiles, an AI Summary panel, or both (All).
- Tile count — for example Showing 15 of 49 when max tiles limits how many cards are on screen.
If nothing is pinned yet, Home asks you to open Filters and pin at least one filter. If you have no data views assigned, Home stays empty — see Users.
View modes
Open the sliders control (display options) in the header.
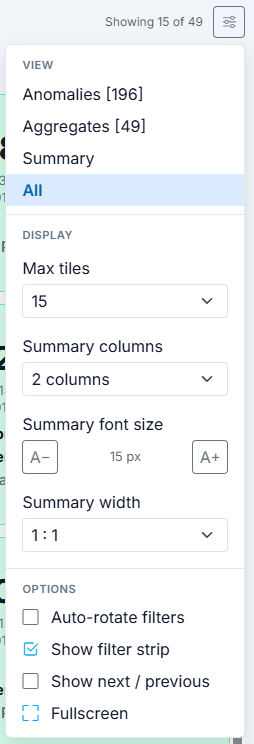
| View | Purpose |
|---|---|
| Anomalies | Individual detection tiles |
| Aggregates | Grouped tiles (when the filter has aggregation enabled) |
| Summary | AI narrative for the active filter (when summarization is enabled and generated) |
| All | Split layout: summary beside tiles |
Display
| Setting | Purpose |
|---|---|
| Max tiles | Cap how many anomaly/aggregate cards to show (5–50, or All) |
| Summary columns | Column layout of the summary text (1–3) |
| Summary font size | A− / A+ for reading comfort |
| Summary width | In All view, relative width of summary vs tiles (for example 1 : 1) |
Options
| Option | Purpose |
|---|---|
| Auto-rotate filters | Cycle through pinned filters on a timer (useful on a wall / kiosk display) |
| Show filter strip | Show or hide the pinned-filter chips under the title |
| Show next / previous | Header chevrons to move between pinned filters |
| Fullscreen | Expand Home for meetings or shared screens |
Working with results
Click a tile to open detail — metrics, common vs different categories, charts, comments, and (for aggregates) the member anomalies. This is the same investigation depth as on the Filters page, without leaving the operational Home layout.
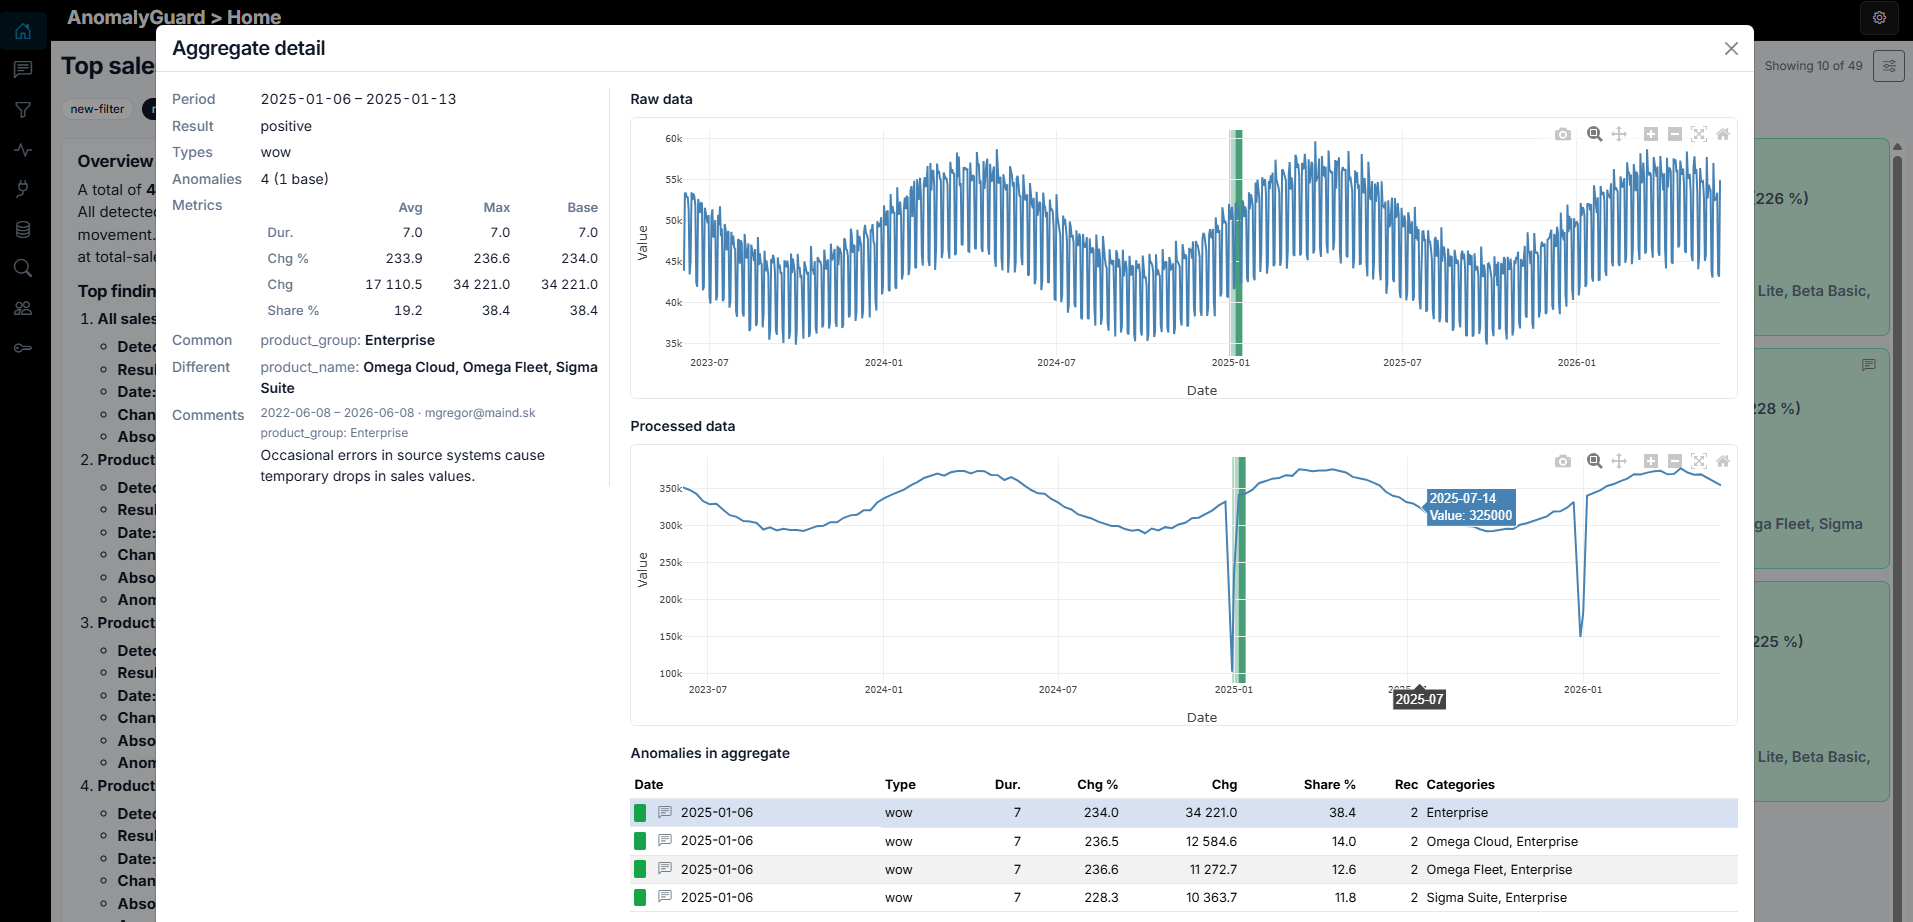
Typical flow:
- Pin the filters that matter for your role (HQ brief, regional watchlist, product line).
- On Home, pick the filter chip (or let auto-rotate cycle them).
- Use All or Summary when you want the narrative first; use Aggregates / Anomalies when you need to drill into cards.
- Open a card for charts and comments before escalating.
Home stays in sync with the filter definition: time range, data views, sort, aggregation, and thresholds all come from the pinned filter. After new data loads and anomaly detection, summaries for filters with AI summarization enabled are refreshed automatically — see Filters — AI summarization.
Beyond the web app
You do not have to consume AnomalyGuard only inside the UI. The same filter definitions, anomaly and aggregate results, comments, and summaries are available through the REST API and CLI, so other systems can pull them on a schedule or on demand:
- BI / reporting tools and data warehouses
- Ticketing or notification pipelines
- Custom dashboards and portals
- AI agents and automation that need structured anomaly context (and optional prose summaries) as input
Start with How to use the API and How to use the CLI. Filter and result endpoints are also summarized under Filters (for example anomalyguard filters …, anomalyguard anomalies by-filter …).