Quantile Threshold (Qt)
YAML type: qt | Category: Quantile
Flags daily points vs a historical quantile of the series.
Description
Qt compares each daily point to a global historical percentile boundary (for example P95). No aggregate mode.
How it works
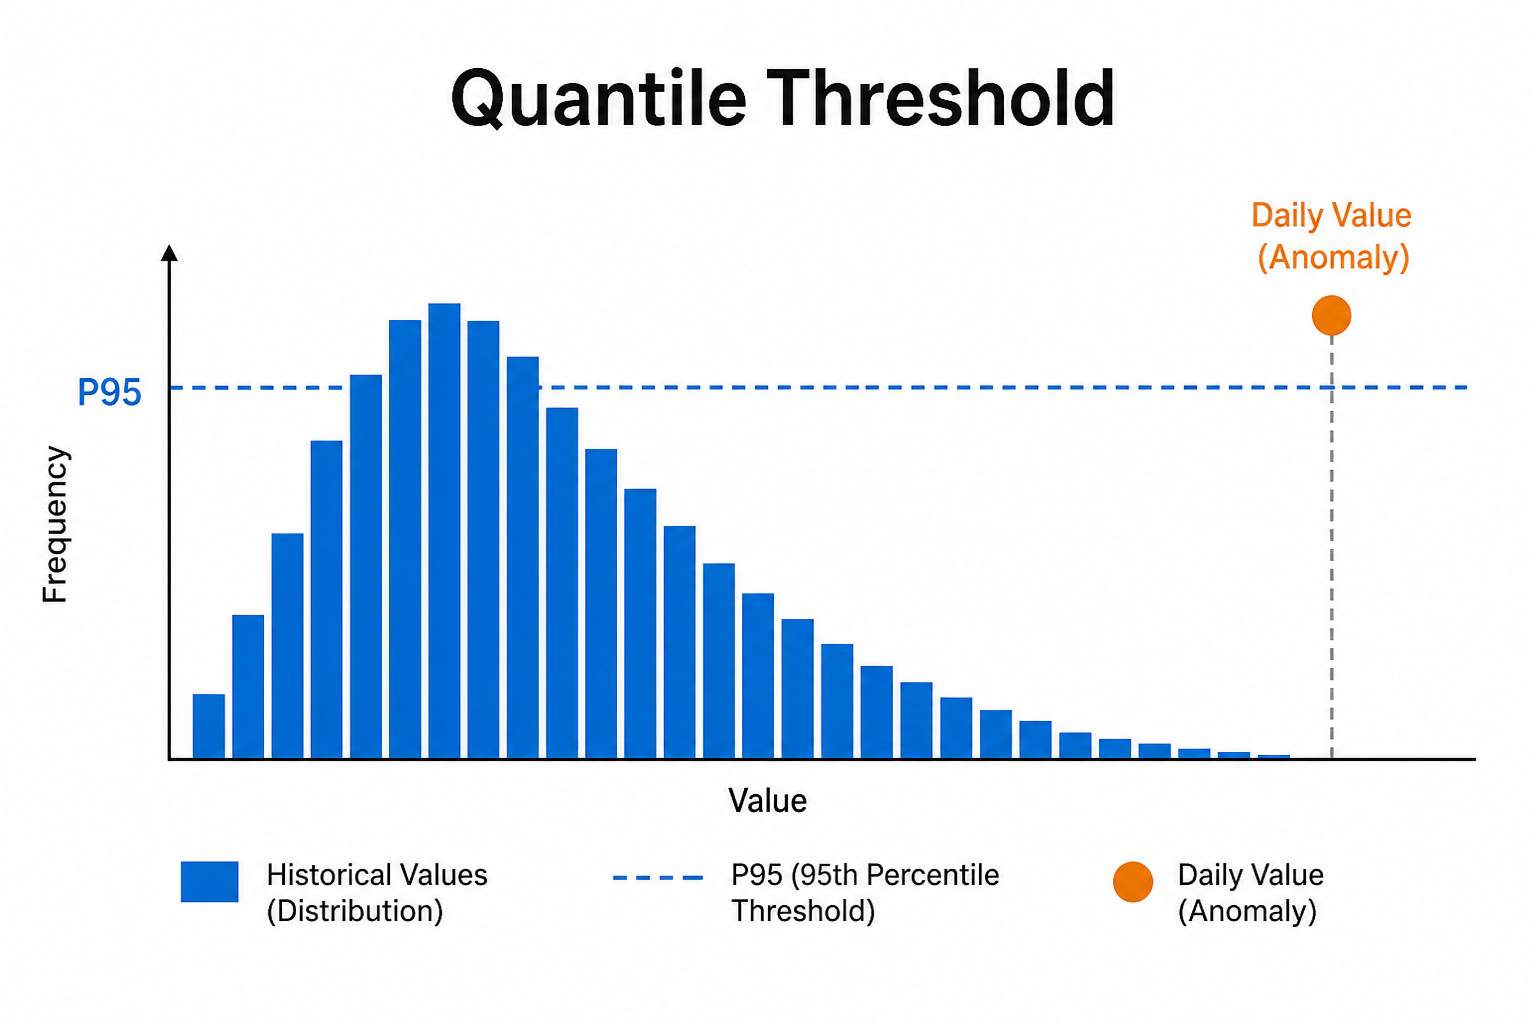
Quantile Threshold builds a historical daily percentile (for example P95) from the series, then compares each new daily point to that boundary.
mode may be above or below (quantile detectors do not implement both). There is no period aggregation -- evaluation stays on the daily grain.
Setup
Pick percentile and mode. Higher percentiles mean rarer high-side alerts.
Configure detectors on the data view Analysis tab or in YAML. Validate with Data Preview before enabling production schedules.
Settings
| Parameter | Default | Description |
|---|---|---|
percentile |
95 |
Historical quantile (0-100) |
mode |
above |
Direction -- see Allowed values |
Allowed values
mode
| Value | Meaning |
|---|---|
above |
Flag values above the quantile boundary |
below |
Flag values below the quantile boundary |
both is not implemented for quantile detectors (qt, qtw, qtm).
Shared series filters
Most detectors also accept optional series filters in params:
| Parameter | Purpose |
|---|---|
maxGapAmount |
Skip series when gap amount is too high (null = no limit). Catalog create-default is often 5. |
minValue |
Skip series whose average value is below this (null = no limit). Catalog create-default is often 1000. |
maxValue |
Skip series whose average value is above this (optional; omit/null = no limit) |
useSpecialDates |
When true, suppress anomalies that overlap special dates |
When a filter skips a series, Data Preview shows the reason.
Configuration example
analysis:
  detectors:
    - type: qt
      params:
        percentile: 95
        mode: above
Using the detector
Good baseline when you want distribution-aware thresholds without explicit seasonal models.
Use cases
- Extreme daily values vs own history
- Capacity headroom alerts
- Low-tail detection for under-delivery
Specifics
Weekly/monthly: qtw, qtm.