Data Views
Data views are the core monitoring unit in AnomalyGuard. Each data view defines source data, categories, detectors, and processing schedule.
Introduction
Data views are views over the data you want to analyze. For AnomalyGuard, that means daily time series across selected categories. As an example, take a data warehouse of sold products: a fact table of sold items organized by products, product groups, countries and regions, sales channels, and marketing strategies. Within those categories there can be tens of thousands of dimension combinations.
| country | region | product group | product | sales channel | marketing strategy | value |
|---|---|---|---|---|---|---|
| SK | West | Electronics | Notebook X1 | Online | PPC campaigns | 58k |
| SK | East | Electronics | Tablet A3 | Retail | Flyers | 19k |
| CZ | Prague | Home | Mixer M200 | Online | Influencers | 12k |
| AT | Vienna | Outdoor | Tent Trek 2 | Distributor | Seasonal promo | 24k |
| HU | Budapest | Food | Bio Snack 50 | Retail | Discount coupons | 7k |
In practice, an analyst can usually only watch the big numbers — sales across large categories. What matters is often hidden in finer detail, in category combinations. That is no longer feasible to review daily by hand. With many dimensions and many members, it is simply not possible to analyze everything at once; there may be millions of combinations.
So we create data views — business-meaningful slices of this data. For example:
- Sales by country and sales channel
| country | sales channel | value |
|---|---|---|
| SK | Online | 58k |
| SK | Retail | 19k |
| CZ | Online | 12k |
| AT | Distributor | 24k |
| HU | Retail | 7k |
- Sales by sales channel and marketing strategy
| sales channel | marketing strategy | value |
|---|---|---|
| Online | PPC campaigns | 58k |
| Retail | Flyers | 19k |
| Online | Influencers | 12k |
| Distributor | Seasonal promo | 24k |
| Retail | Discount coupons | 7k |
- Sales by country, product, and product group
| country | product | product group | value |
|---|---|---|---|
| SK | Notebook X1 | Electronics | 58k |
| SK | Tablet A3 | Electronics | 19k |
| CZ | Mixer M200 | Home | 12k |
| AT | Tent Trek 2 | Outdoor | 24k |
| HU | Bio Snack 50 | Food | 7k |
Automated analyses then run over these data views. The views are computationally tractable, and final results can still be combined into one aggregated picture.
Note
AnomalyGuard is especially powerful when your dataset has many categories. It can walk combinations of those dimensions, find changes and anomalies, and aggregate them into a readable, actionable form.
The number of data views you can analyze depends on your license. A higher license increases how many data views you can run.
Recommended workflow
- Create a connector for the source database.
- Add Data View — set General (name, domain, connector) and Source (load query, load mode, date/value columns).
- Define Categories (names must match SQL columns; set parents for hierarchies).
- Configure Analysis — detectors YAML, load trigger, fill-gap / ignore / scan settings.
- Optionally define Special Dates for known calendar effects.
- Save, then on Management click Deploy.
- Turn Enabled on and save.
- Run an initial load (Load data using custom query or Start normal daily load), then Start detection analytics jobs.
- Validate series and detectors in Data Preview before relying on production schedules.
- Build Filters for consumers; watch jobs on Monitoring.
Data View editor
To manage data views, click DataViews in the left side panel.
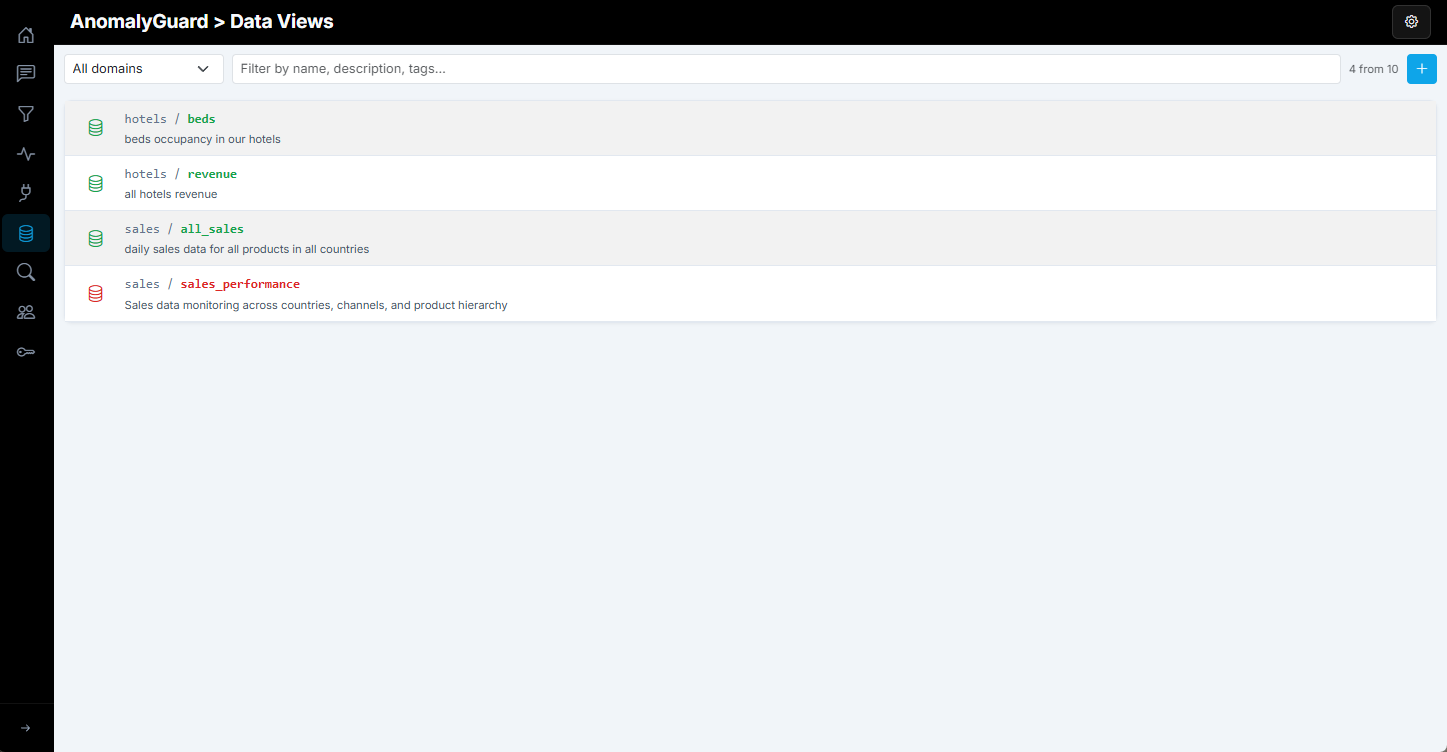
A list of existing data views appears. Status colors:
- Red — saved, not deployed (prepared)
- Gray — deployed but disabled
- Green — deployed and enabled
To create a data view, click Add Data View in the top-right corner. To edit one, click it in the list.
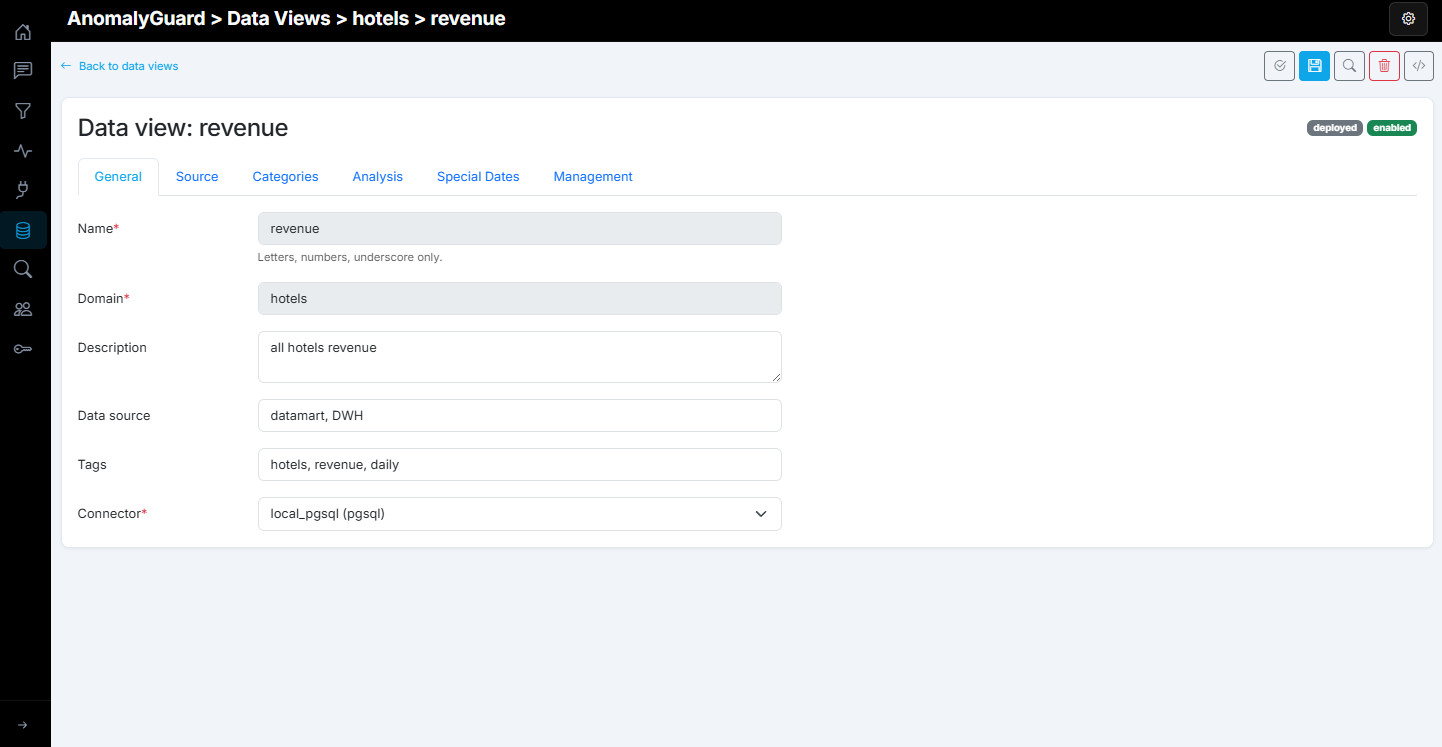
The data view editor opens. Settings are split across several tabs:
| Tab | Contents |
|---|---|
| General | Name, domain, description, data source, tags, connector |
| Source | Load query, custom load query, load mode, date/value columns |
| Categories | Dimension hierarchy and labels |
| Analysis | Detector YAML, load trigger (cron or REST API), fill-gap method, ignore/scan day limits |
| Special Dates | Calendar effects YAML (specialDates, recurringRules, specialPeriods) |
| Management | Deploy, enable, start jobs, clean/delete deployment |
General
On the first tab, set the basic parameters: Name, Domain (grouping for data views), Description, optional Data source and Tags, and the Connector used to load input data.
| Field | Purpose |
|---|---|
| Name | Technical identifier (letters, numbers, underscore). Locked after deploy. |
| Domain | Logical group (for example sales, finance). Used in API job URLs as {domain}/{name}. Locked after deploy. |
| Description | Free-text description shown in the list and detail. |
| Data source | Optional origin label (for example ERP, CRM). Stored as metadata (dataSource in YAML) for operators and documentation. |
| Tags | Comma-separated labels for organization. Used in the Data Views list filter and in the API/CLI list filter (?tag= / --tag). |
| Connector | Encrypted connection used to run load queries. See Connectors. |
Source
On the Source tab, define the SQL Load query. It should return current data — for example D-1 for an incremental load. When volumes are small, you can use a simpler full load that returns the entire analysis period. Prefer incremental loads when a full load would pull tens of millions of rows every day.
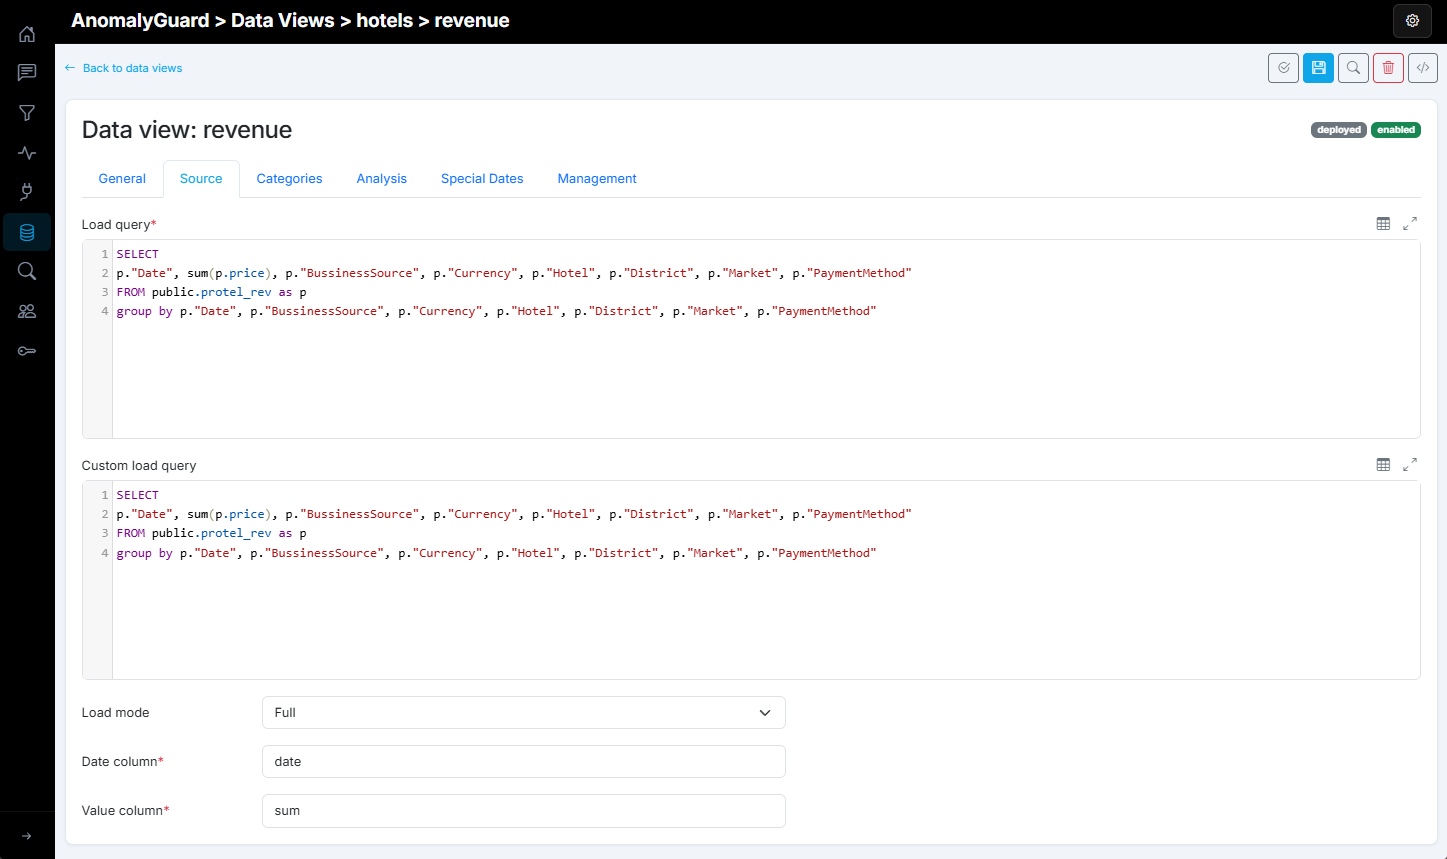
Custom load query defines an optional custom load — for example an initial full load or a query that supplies corrected data for a longer period. After saving, you can run that load manually from the Management tab.
Warning
1) The date input to the application must be an integer in YYYYMMDD format. If the source DB uses DateTime (or similar), convert in the SELECT, for example:
CAST(to_char("Date", 'YYYYMMDD') AS int) AS date_int
2) Values for count and value must be numeric. Other categorical columns should be text.
3) In both query definitions, avoid:
SELECT * FROM TableA
Always select columns explicitly. That avoids several problems later.
4) If a query loads data for a selected day, always return all rows for that date. Incremental load takes the set of dates present in the new batch, deletes existing values for those dates, then loads the new data.
5) The output query must (in the current version) provide both measure columns. If you only analyze a sum/value measure, define the unused measure as a constant, for example:
SELECT 1 as 'Count' FROM ....
6) Output column names in the SELECT must match the names used under Categories in the Name column.
After defining a query, you can pull sample data (TOP 10 rows) with Load sample data above the query editor. The app runs the query and shows the result in a popup table.
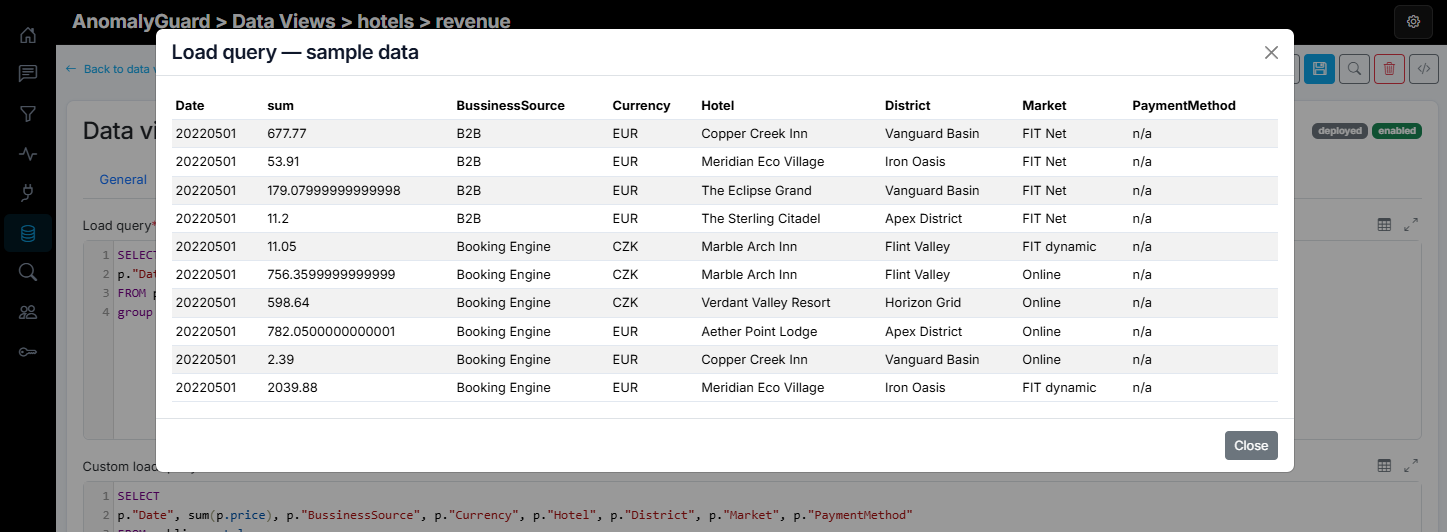
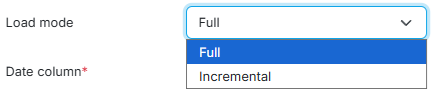
Below the query editors, set Load mode:
- Full — the input data table is cleared on each load
- Incremental — only data for dates from
min(date)in the loaded batch are replaced
Finally, set Date column and Value column to the SQL column names that hold the date and the numeric measure you track.
Categories
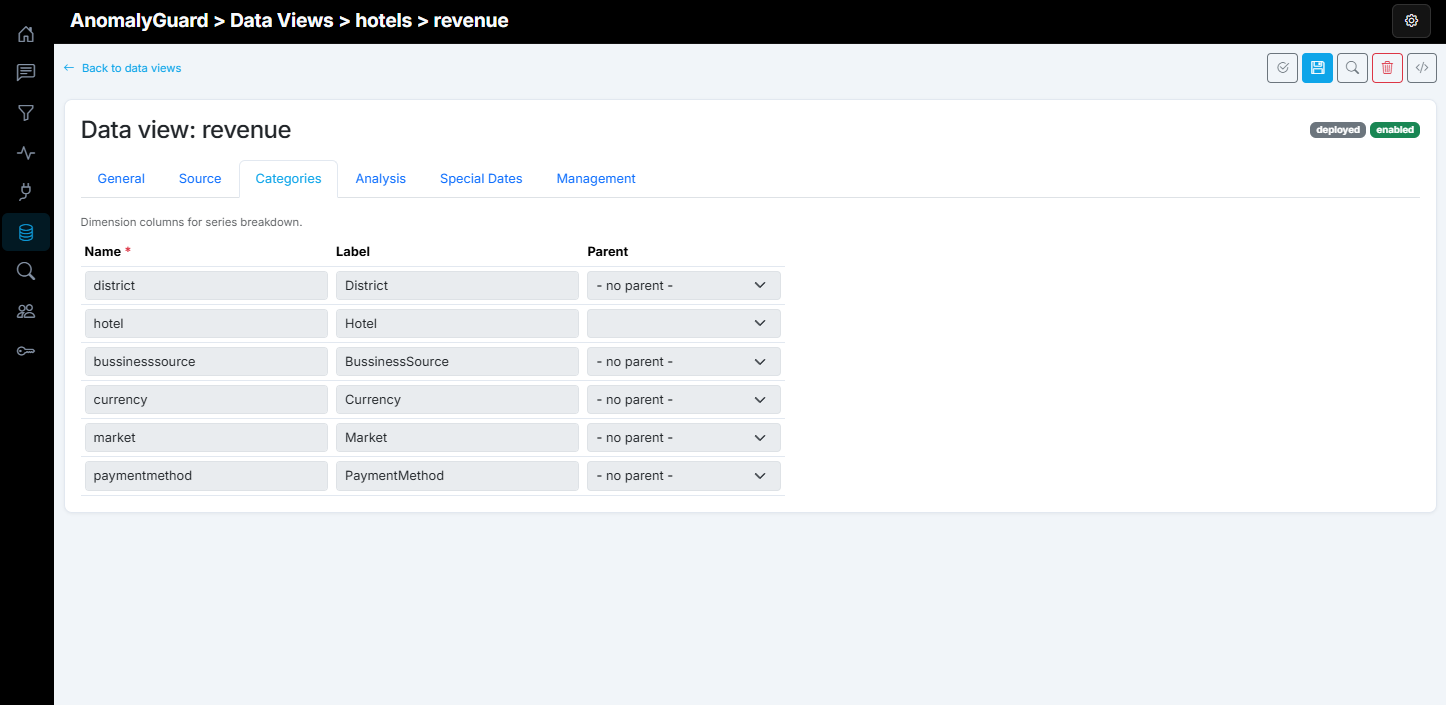
Next, define categories — the categorical dimensions whose combinations you search for anomalies. Besides date and value, the SQL SELECT returns N categorical columns. The app needs those categories declared so it can evaluate combinations.
For each category, set three parameters:
- Name — column name in the SQL SELECT
- Label — display name used inside AnomalyGuard
- Parent — optional hierarchical link (for example Country → Region → City, or Product group → Product). Parent links stop AnomalyGuard from generating impossible category combinations. If no parent is set, all combinations are generated automatically.
Analysis
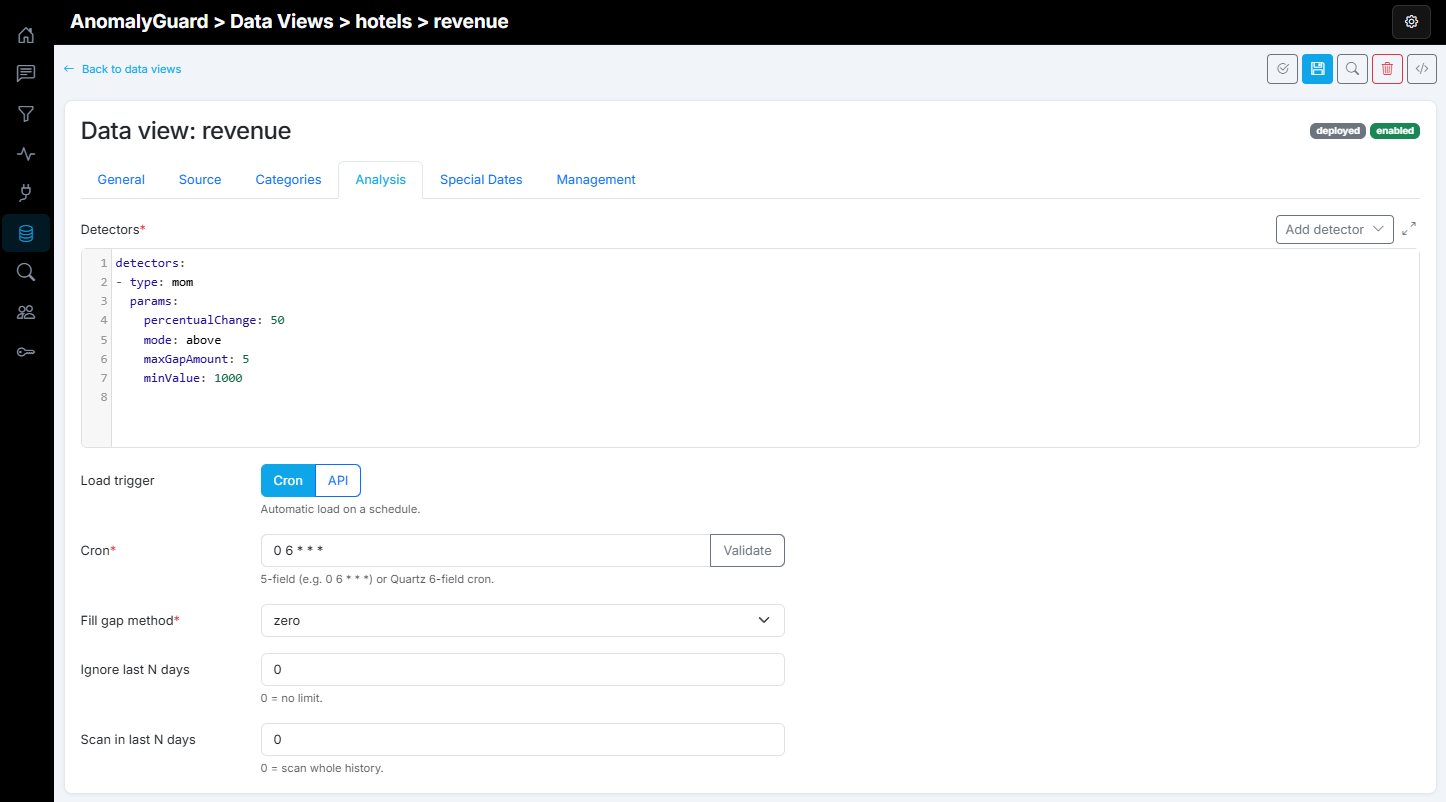
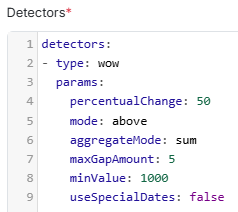
With source and categories defined, configure anomaly analysis on the Analysis tab. The main setting is Detectors: YAML that defines detection algorithms. You can attach any number of detectors to one data view. Detector types and usage are described in the Detectors section.
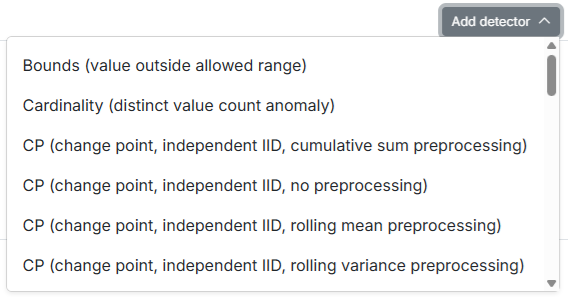
Use Add detector above the editor to insert sample detector snippets. Multiple detectors can cover different aspects of anomalies in the same data. After analysis, Filters select and present results to different audiences from one or more data views.
Then choose how load and analysis are started regularly:
- Cron — run on a fixed schedule
- API — start on demand from an external system via an API request
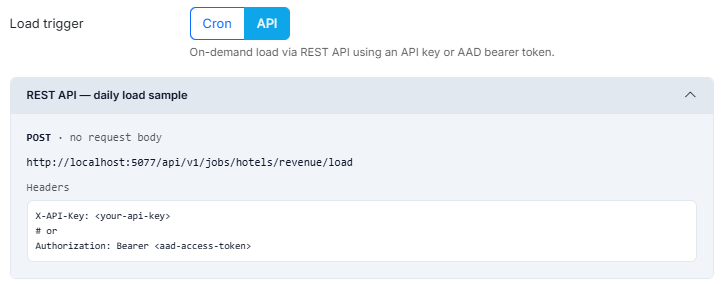
If you choose API, the UI shows a REST API — daily load sample panel with the URL and auth headers. Call this at the end of a DWH load from an orchestration tool such as Data Factory, Fabric Pipelines, or Apache Airflow. With Cron, the load starts at the configured schedule.
Example (no request body). Prefer an API key with process permission, or a Bearer token:
POST https://<host>/api/v1/jobs/{domain}/{name}/load
X-API-Key: <your-api-key>
Equivalent data-view routes also exist:
POST https://<host>/api/v1/dataviews/{domain}/{name}/jobs/load
POST https://<host>/api/v1/dataviews/{id}/jobs/load
Related job paths: process (analytics) and custom-load (custom load query). The data view must be deployed and enabled for normal load/process jobs.
Cron definition
Cron uses six fields:
| sec | min | hour | day | month | day-of-week |
|---|---|---|---|---|---|
| * | * | * | * | * | * |
| 0–59 | 0–59 | 0–23 | 1–31 | 1–12 | 0–6 |
Basic rules for fields:
- Numbers in the range of each field.
-
- = any value.
- Interval */n = every n units.
- List a,b,c = specific values.
- Range a-b = from a to b.
- day-of-week: 0 = Sunday, 6 = Saturday (most libraries).
- Conflict "day" vs "day-of-week" usually works as OR, not AND.
Cron examples:
- Every day at 03:00:
0 0 3 * * * - Every Saturday at 06:00:
0 0 6 * * 6 - First day of each month at 01:00:
0 0 1 1 * *
Cron start: - An active cron will start a new daily load only if there is no other job currently in progress (e.g. a previous daily load, a custom load, or a custom analysis).
The UI also accepts a 5-field cron (for example 0 6 * * *). Use Validate to preview the next scheduled runs.
Next, configure three more parameters. Fill gap method controls what happens on days with no data. You can fill gaps with zero, linear interpolation between known values, or previous (last known value). Gap-filled data then feeds the detectors (except the GAP detector).
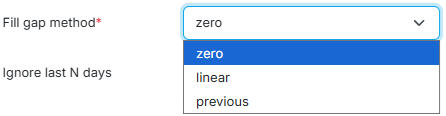
Ignore last N days excludes the most recent N days from analysis. Useful for late-arriving facts, when part of the data for recent days arrives later or gradually. Those days are left out so detectors do not raise false anomalies.
Scan in last N days limits how far back the time series is analyzed — for example only the last three years (0 = whole history).

On individual detectors you can set useSpecialDates: true. When enabled, anomalies that fall on configured special dates are suppressed.
Special Dates
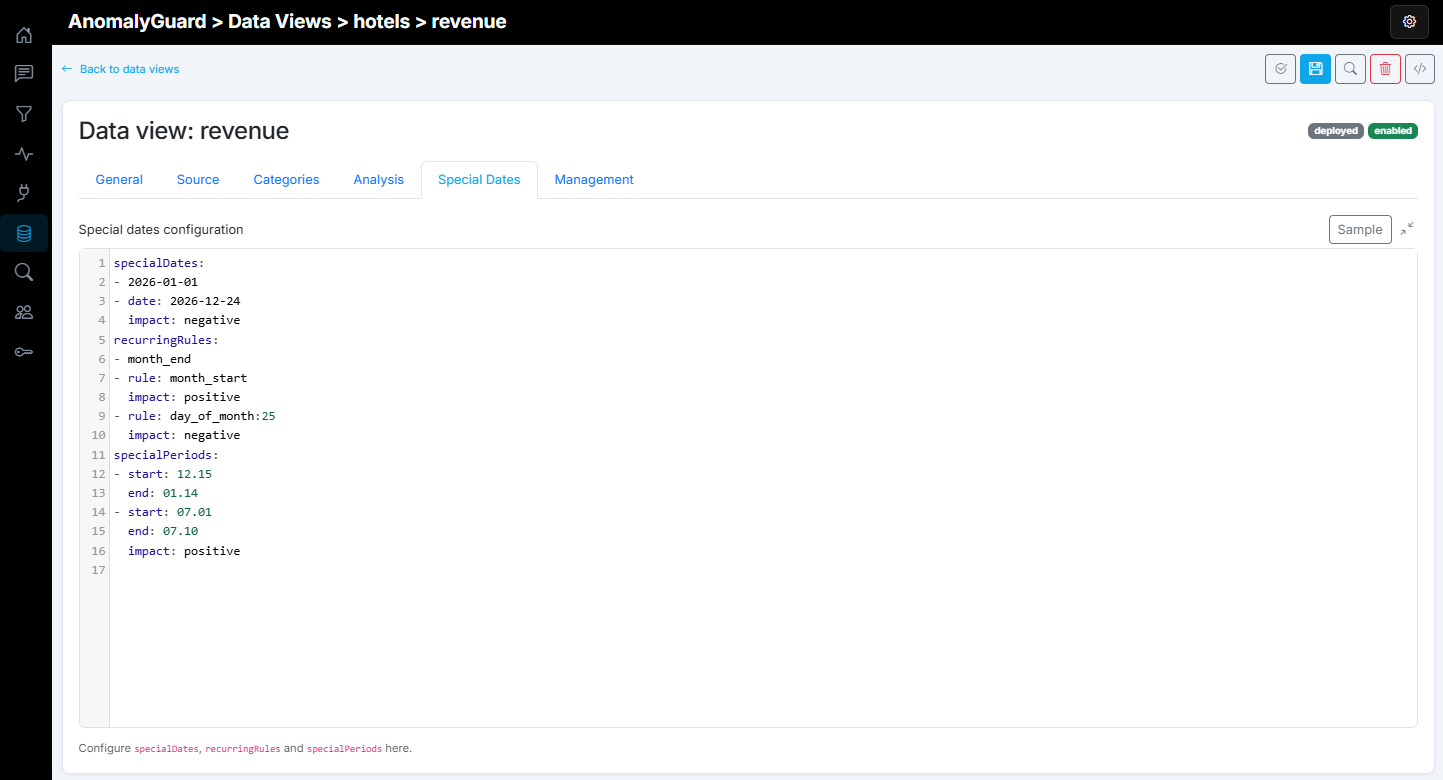
Define special dates on the Special Dates tab in the YAML editor. These are calendar periods where anomalies are expected (for example a source-system outage or recurring month-end adjustments) and should not be reported when a detector has useSpecialDates: true.
In the editor you define the time coverage and the impact type. Anomalies whose direction matches the impact and overlap a special date or period are excluded from detector output. Impact values:
| Impact | Meaning |
|---|---|
both |
Suppress positive and negative anomalies (default if omitted) |
positive |
Suppress only positive anomalies |
negative |
Suppress only negative anomalies |
You can combine three definition types in one YAML document:
specialDates — exact dates
One-off dates in yyyy-MM-dd format. Each entry can be a plain date string (impact defaults to both) or an object with date and optional impact.
specialDates:
  - "2026-01-01"
  - date: "2026-12-24"
    impact: negative
recurringRules — repeating calendar rules
Rules that apply every month (or on a fixed day of month):
| Rule | Meaning |
|---|---|
month_start |
First day of each month |
month_end |
Last day of each month |
day_of_month:<1..31> |
Fixed day of month (for example day_of_month:25) |
Each entry can be a plain rule string or an object with rule and optional impact.
recurringRules:
  - "month_end"
  - rule: "month_start"
    impact: positive
  - rule: "day_of_month:25"
    impact: negative
specialPeriods — recurring date ranges
Seasonal or multi-day windows using start / end in MM.dd format. Ranges may cross the year boundary (for example 12.15–01.14). Optional impact defaults to both.
specialPeriods:
  - start: "12.15"
    end: "01.14"
    impact: both
  - start: "07.01"
    end: "07.10"
    impact: positive
The Special Dates editor includes a Sample template button.
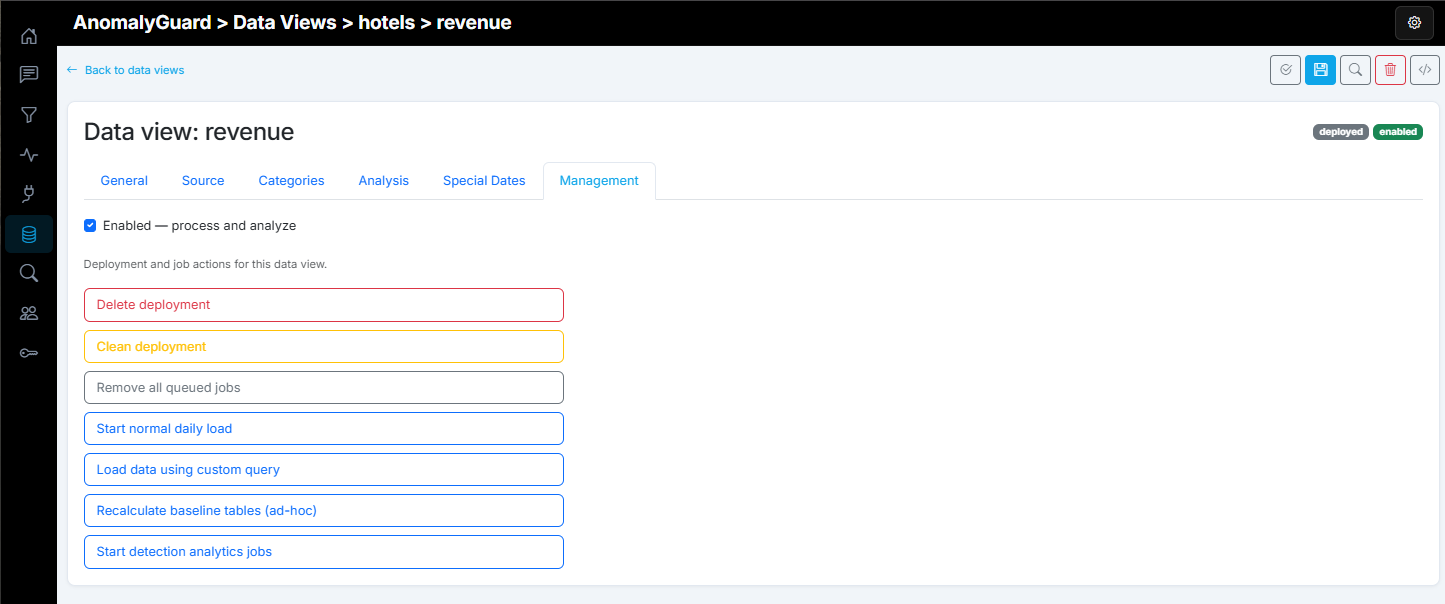
Management
After the data view is saved, open the Management tab to deploy it and run job actions. Until the data view is saved for the first time, the tab only shows a message that management actions are unavailable.
Enabled checkbox
Shown only when the data view is deployed. When checked (Enabled — process and analyze), scheduled and manual load/analytics jobs are allowed. Deploy always leaves the data view disabled — turn Enabled on and save after a successful deploy. Job buttons that require an enabled data view stay hidden while it is disabled.
Actions
Buttons appear based on deployment state, enabled flag, and whether a custom load query is defined. While an action runs, all management buttons are disabled.
| Button | Visible when | What it does |
|---|---|---|
| Deploy | Saved and not deployed | Validates the definition, creates DB tables for the data view (int, data, cat_map, all_series, and baseline tables), and marks it deployed (still disabled). |
| Delete deployment | Deployed | Drops all data-view tables and data, clears deployed/enabled flags. Use this before changing Categories (or name/domain), which are locked after deploy. |
| Clean deployment | Deployed | Truncates table data (int, data, cat_map, all_series, all_anomalies) and removes related jobs. Tables remain; the data view stays deployed. |
| Remove all queued jobs | Deployed | Deletes pending/queued jobs for this data view. Fails if none are queued. |
| Start normal daily load | Deployed and enabled | Enqueues the standard load job using the main load query (same path as the cron trigger). |
| Load data using custom query | Deployed and a custom load query is set on the Source tab | Enqueues a custom load job (CustomLoadIntData). Does not require Enabled. |
| Recalculate baseline tables (ad-hoc) | Deployed | Rebuilds peer / mix / cardinality baseline tables from current detector settings. Only runs for detectors of those types that are defined; otherwise reports that none apply. |
| Start detection analytics jobs | Deployed and enabled | Enqueues process/analytics jobs that run detectors on the currently loaded dataset. |
If none of the conditions above match, the tab shows that no management actions are available.
Deployment status
While the data view is not deployed (prepared), you can edit all settings. The only management action is Deploy.
After deployment, Categories, Name, and Domain are locked because they are tied to generated DB objects. To change categories later, use Delete deployment, edit the definition, deploy again, then reload and re-run analysis.
Job actions (Start normal daily load, Start detection analytics jobs, and related buttons) appear only after deploy, with the visibility rules in the table above.
YAML definition and CI/CD
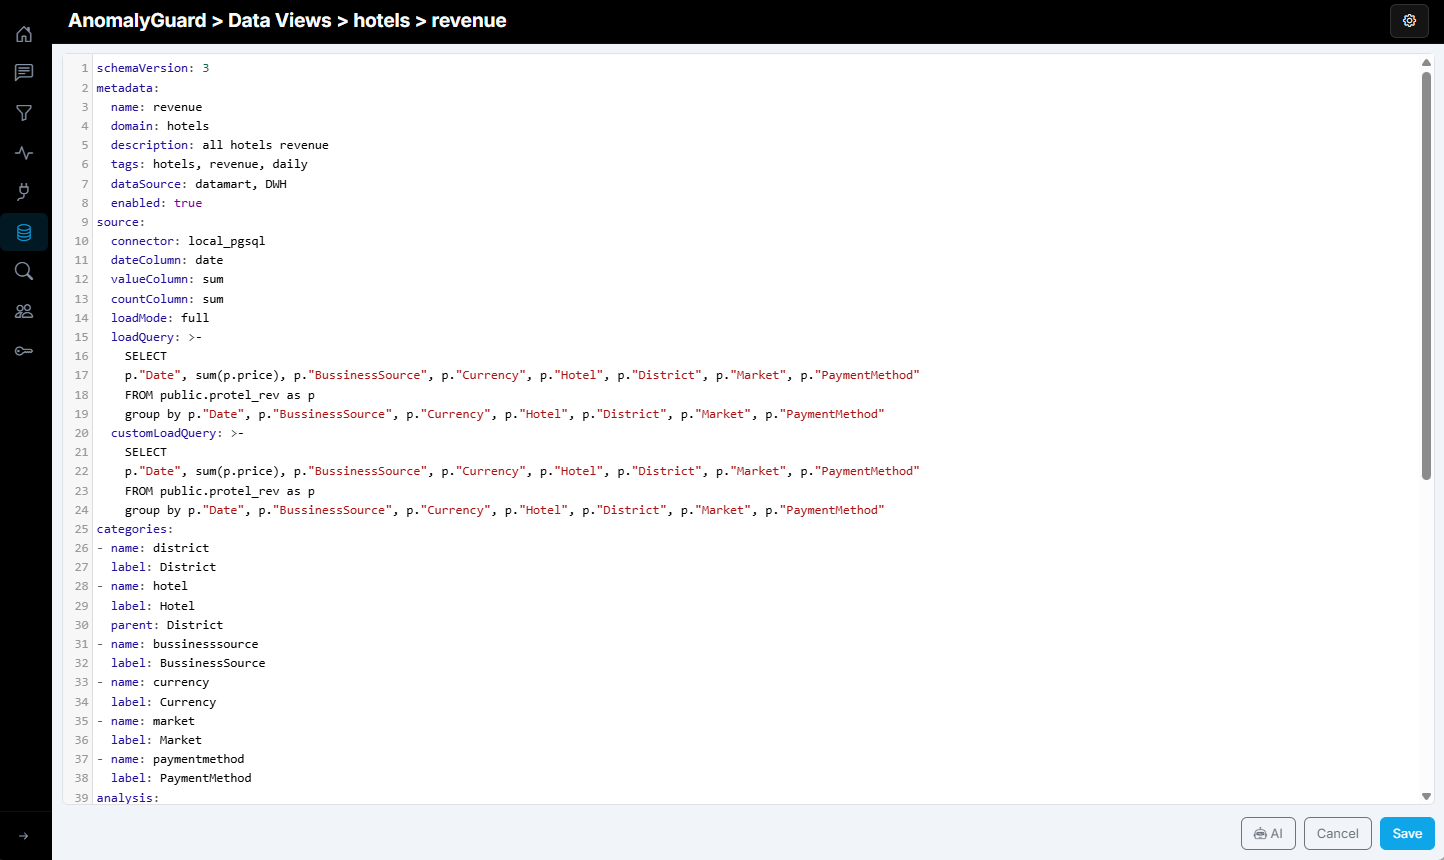
All data view settings can be viewed not only in the form UI, but also as a single YAML definition. Use the YAML definition button (</> icon) in the top-right corner of the data view page to open the full configuration editor. That YAML includes general settings, source queries, categories, detectors, special dates, and related analysis options. You can copy or export this definition and store it in Git so data views stay versioned.
Typical CI/CD pattern:
- Keep the YAML (or the equivalent Fact JSON from
GET /api/v1/dataviews/{id}) in source control. - Apply create/update via API or CLI (
anomalyguard dataviews create|update --file …expects Fact JSON). - Deploy, enable, and enqueue jobs from the pipeline (
deploy,enable,jobs-load,jobs-process).
Example YAML shape (abbreviated):
schemaVersion: 3
metadata:
  name: sales_by_channel
  domain: sales
  description: Daily sales by country and channel
  tags: retail, daily
  dataSource: ERP
  enabled: true
source:
  connector: warehouse_pgsql
  dateColumn: order_date
  valueColumn: amount
  loadMode: incremental
  cron: "0 6 * * *"
  loadQuery: |
    SELECT CAST(to_char(order_date, 'YYYYMMDD') AS int) AS order_date,
           country, channel, amount, 1 AS count
    FROM sales.daily_facts
    WHERE order_date = CURRENT_DATE - 1
  customLoadQuery: |
    SELECT CAST(to_char(order_date, 'YYYYMMDD') AS int) AS order_date,
           country, channel, amount, 1 AS count
    FROM sales.daily_facts
    WHERE order_date >= CURRENT_DATE - 365
categories:
  - name: country
    label: Country
  - name: channel
    label: Sales channel
    parent: country
analysis:
  fillGapMethod: zero
  ignoreLastNDays: 1
  scanInLastNDays: 1095
  detectors:
    - type: dod
      params:
        percentualChange: 40.0
        mode: both
        useSpecialDates: true
    - type: gap
      params:
        longerThan: 3
        shorterThan: 0
  specialDates:
    - "2026-01-01"
  recurringRules:
    - "month_end"
  specialPeriods:
    - start: "12.15"
      end: "01.14"
      impact: both
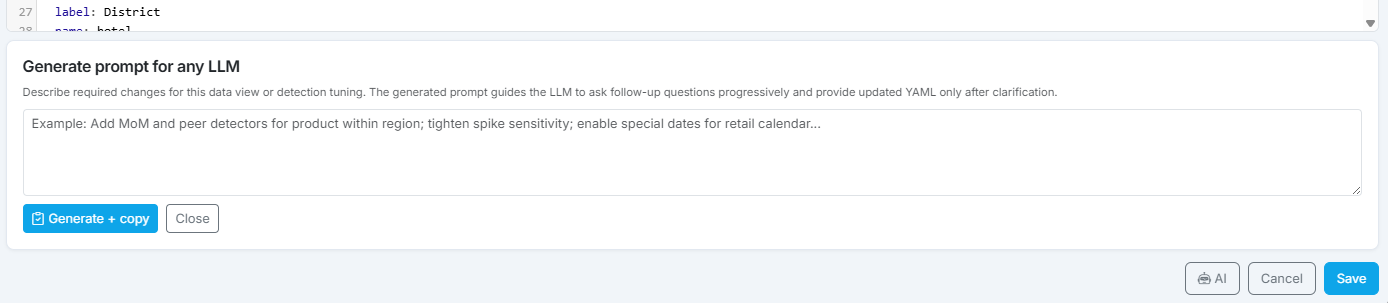
From the YAML editor you can also generate a prompt for an external LLM. Click AI, describe the data view and detection setup you need (or the changes you want), then use Generate + copy. The app builds a guided prompt and copies it to the clipboard. Paste it into any chat agent; the agent can ask follow-up questions and then return a complete data view YAML. Copy that YAML back into the editor and save.
Validate with Data Preview
After the data view is deployed and data is loaded (or while tuning detectors), open Data preview from the top-right search icon on the data view page (/dataviews/{id}/preview).
Use it to:
- Inspect raw and processed (gap-filled) series charts for selected category combinations
- Dry-run detector YAML before production schedules pick up changes
- See why detectors were skipped (for example gap amount too high, average outside
minValue/maxValue) - Review detected anomalies for the preview run
Detectors are optional on the preview page — with none configured it still renders charts. Full workflow: Data Preview.
License limits
The Marketplace plan caps how many data views you can create (total count — not only enabled or deployed). See License.
| Action | Behavior |
|---|---|
| Create | Blocked when the plan limit is reached (License limit reached: max N data views.) |
| Enable / save / update | Not blocked by the create limit |
| Load / process jobs | Report a license warning if the current count exceeds the plan (for example after a plan change) |
Administrators see a usage counter on the Data Views list (for example 3 from 5). Inspect usage via anomalyguard system license --json.
After jobs start — Monitoring
When you enqueue a load or analytics job (UI, cron, or API), open Monitoring to track progress:
| What to watch | Meaning |
|---|---|
| Pending / running | Job is queued or executing (Warning badge while in progress) |
| Failed | At least one task failed (Critical) — open detail and inspect the error |
| Finished + data loaded | Load completed; ready for process/analytics if not already chained |
| Load date / data range | Confirms the window that was loaded |
| Anomalies count | After process jobs finish |
Job types for a data view: Load, Process, and Custom load. Clear stuck queues with Remove all queued jobs (Management) or anomalyguard dataviews jobs-clear {id}.
Troubleshooting
| Symptom | Likely cause / fix |
|---|---|
| Deploy validation fails | Connector missing, invalid detectors YAML, incomplete categories, or invalid cron/API load trigger — fix errors shown in the UI |
| Tables already exist on deploy | Leftover tables from a previous attempt — clean DB objects or use Delete deployment if the view is still marked deployed |
| Cannot edit Categories / Name / Domain | Data view is deployed — Delete deployment, edit, deploy again |
| Job buttons missing | Not saved, not deployed, and/or not Enabled; custom load also needs a custom load query |
| "A load task … is already in the queue" | Wait for the existing load to finish, or Remove all queued jobs |
| "No queued jobs found" | Nothing to clear — expected if the queue is empty |
| False anomalies on recent days | Raise Ignore last N days for late-arriving facts |
| Calendar noise (holidays, month-end) | Define Special Dates and set useSpecialDates: true on detectors |
| Create fails with license limit | Delete unused views or upgrade plan — see License |
| Sample / load query errors | Prefer explicit column lists (not SELECT *); date as YYYYMMDD int; category Name values must match SELECT aliases |
| Baseline rebuild does nothing useful | Only peer, mix, and cardinality detectors have baseline tables |
REST API
Base path: /api/v1/dataviews
Common operations:
| Method | Path | Description |
|---|---|---|
| GET | / |
List accessible data views (?name=, ?domain=, ?tag=) |
| GET | /lite |
Lite list for current user |
| GET | /{id} |
Get full definition |
| GET | /{id}/status |
Processing status |
| GET | /{id}/categories |
Categories (admin) |
| POST | / |
Create (admin) — blocked at license limit; body = Fact JSON |
| PUT | /{id} |
Update (admin) — Fact JSON |
| DELETE | /{id} |
Delete (admin) |
| POST | /{id}/deploy |
Deploy (admin) |
| POST | /{id}/undeploy |
Delete deployment (admin) |
| POST | /{id}/clean |
Clean deployment data (admin) |
| POST | /{id}/enable |
Enable (admin) |
| POST | /{id}/disable |
Disable (admin) |
| POST | /{id}/jobs/load |
Enqueue load |
| POST | /{id}/jobs/process |
Enqueue analytics |
| POST | /{id}/jobs/custom-load |
Enqueue custom load |
| POST | /{id}/jobs/clear |
Clear queued jobs (admin) |
| POST | /{domain}/{name}/jobs/load |
Enqueue load by domain/name |
| POST | /{domain}/{name}/jobs/process |
Enqueue process by domain/name |
| POST | /{domain}/{name}/jobs/custom-load |
Enqueue custom load by domain/name |
Orchestration-friendly aliases (same behavior):
| Method | Path |
|---|---|
| POST | /api/v1/jobs/{domain}/{name}/load |
| POST | /api/v1/jobs/{domain}/{name}/process |
| POST | /api/v1/jobs/{domain}/{name}/custom-load |
See also How to use the API.
CLI
anomalyguard dataviews list
anomalyguard dataviews list --tag retail --domain sales
anomalyguard dataviews list-lite
anomalyguard dataviews get 5
anomalyguard dataviews status 5
anomalyguard dataviews create --file dataview.json
anomalyguard dataviews update 5 --file dataview.json
anomalyguard dataviews delete 5
anomalyguard dataviews deploy 5
anomalyguard dataviews undeploy 5
anomalyguard dataviews clean 5
anomalyguard dataviews enable 5
anomalyguard dataviews disable 5
anomalyguard dataviews jobs-load 5
anomalyguard dataviews jobs-process 5
anomalyguard dataviews jobs-custom-load 5
anomalyguard dataviews jobs-clear 5
anomalyguard dataviews categories 5
Job commands also accept domain/name where supported. See How to use the CLI.
Related
- Connectors
- Detectors
- Data Preview
- Special settings (special dates, LLM)
- Filters
- Monitoring
- How to use the API
- How to use the CLI
- License